Xanthomonas phage XAJ2
Taxonomy: Viruses; Duplodnaviria; Heunggongvirae; Uroviricota; Caudoviricetes; Caudovirales; Siphoviridae; unclassified Siphoviridae
Average proteome isoelectric point is 6.7
Get precalculated fractions of proteins
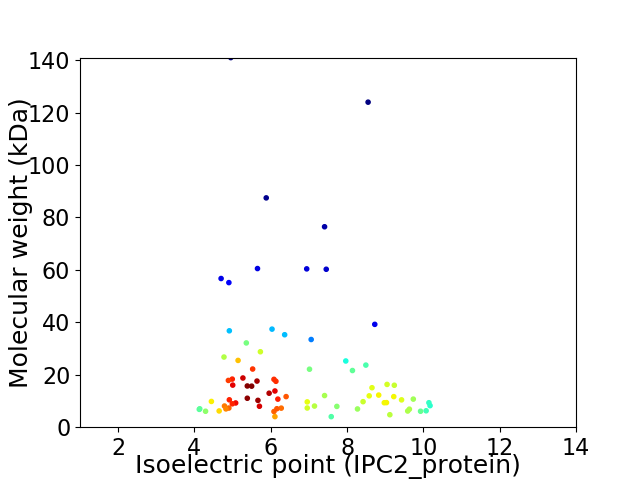
Virtual 2D-PAGE plot for 79 proteins (isoelectric point calculated using IPC2_protein)
Get csv file with sequences according to given criteria:
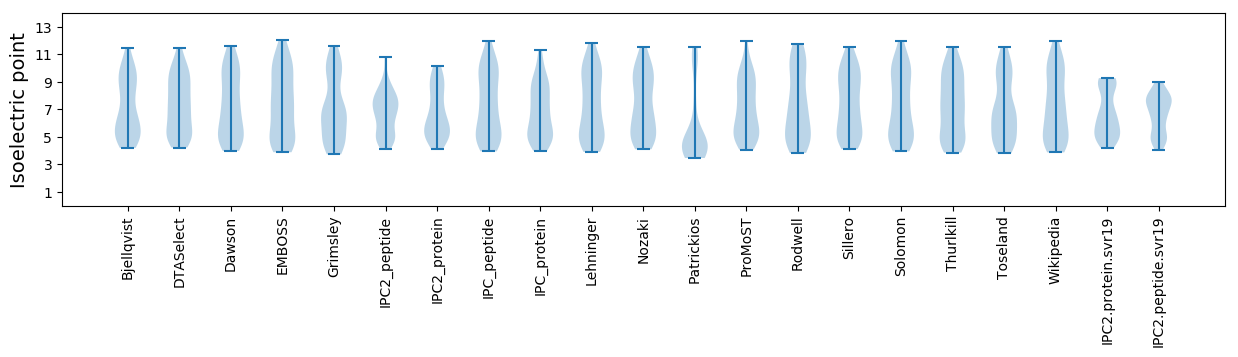
* You can choose from 21 different methods for calculating isoelectric point
Summary statistics related to proteome-wise predictions
Protein with the lowest isoelectric point:
>tr|A0A1I9L2H5|A0A1I9L2H5_9CAUD Uncharacterized protein OS=Xanthomonas phage XAJ2 OX=1775249 PE=4 SV=1
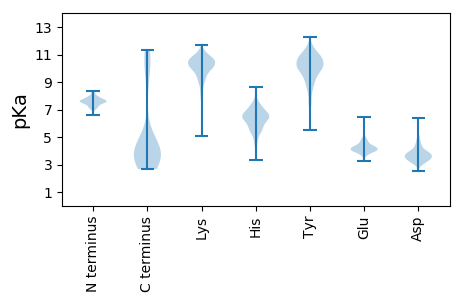
MM1 pKa = 7.38KK2 pKa = 10.29RR3 pKa = 11.84FIIEE7 pKa = 3.98VVCANASTLQEE18 pKa = 4.26ALDD21 pKa = 3.93FASACIGEE29 pKa = 4.7DD30 pKa = 3.18PTRR33 pKa = 11.84YY34 pKa = 9.84NQMQVDD40 pKa = 4.06EE41 pKa = 4.64TDD43 pKa = 3.68EE44 pKa = 4.01QLSDD48 pKa = 3.51PDD50 pKa = 4.31YY51 pKa = 10.27IKK53 pKa = 11.11SSITRR58 pKa = 11.84NEE60 pKa = 3.49
MM1 pKa = 7.38KK2 pKa = 10.29RR3 pKa = 11.84FIIEE7 pKa = 3.98VVCANASTLQEE18 pKa = 4.26ALDD21 pKa = 3.93FASACIGEE29 pKa = 4.7DD30 pKa = 3.18PTRR33 pKa = 11.84YY34 pKa = 9.84NQMQVDD40 pKa = 4.06EE41 pKa = 4.64TDD43 pKa = 3.68EE44 pKa = 4.01QLSDD48 pKa = 3.51PDD50 pKa = 4.31YY51 pKa = 10.27IKK53 pKa = 11.11SSITRR58 pKa = 11.84NEE60 pKa = 3.49
Molecular weight: 6.8 kDa
Isoelectric point according different methods:
Protein with the highest isoelectric point:
>tr|A0A1I9L2I4|A0A1I9L2I4_9CAUD Uncharacterized protein OS=Xanthomonas phage XAJ2 OX=1775249 PE=4 SV=1
MM1 pKa = 7.65SYY3 pKa = 10.77AISSKK8 pKa = 10.91AKK10 pKa = 8.57IPKK13 pKa = 9.42RR14 pKa = 11.84YY15 pKa = 9.02RR16 pKa = 11.84PKK18 pKa = 10.16RR19 pKa = 11.84PPVPVVNAMAAYY31 pKa = 8.19AKK33 pKa = 9.98QYY35 pKa = 9.76KK36 pKa = 8.88RR37 pKa = 11.84VYY39 pKa = 9.78GIQPTYY45 pKa = 11.15VYY47 pKa = 10.73DD48 pKa = 3.75HH49 pKa = 6.18KK50 pKa = 10.01TKK52 pKa = 10.64FIRR55 pKa = 11.84VGEE58 pKa = 4.2SGGVSLQRR66 pKa = 11.84IRR68 pKa = 11.84QLTAQLQLRR77 pKa = 11.84AGEE80 pKa = 4.19EE81 pKa = 4.21SS82 pKa = 3.26
MM1 pKa = 7.65SYY3 pKa = 10.77AISSKK8 pKa = 10.91AKK10 pKa = 8.57IPKK13 pKa = 9.42RR14 pKa = 11.84YY15 pKa = 9.02RR16 pKa = 11.84PKK18 pKa = 10.16RR19 pKa = 11.84PPVPVVNAMAAYY31 pKa = 8.19AKK33 pKa = 9.98QYY35 pKa = 9.76KK36 pKa = 8.88RR37 pKa = 11.84VYY39 pKa = 9.78GIQPTYY45 pKa = 11.15VYY47 pKa = 10.73DD48 pKa = 3.75HH49 pKa = 6.18KK50 pKa = 10.01TKK52 pKa = 10.64FIRR55 pKa = 11.84VGEE58 pKa = 4.2SGGVSLQRR66 pKa = 11.84IRR68 pKa = 11.84QLTAQLQLRR77 pKa = 11.84AGEE80 pKa = 4.19EE81 pKa = 4.21SS82 pKa = 3.26
Molecular weight: 9.34 kDa
Isoelectric point according different methods:
Peptides (in silico digests for buttom-up proteomics)
Below you can find in silico digests of the whole proteome with Trypsin, Chymotrypsin, Trypsin+LysC, LysN, ArgC proteases suitable for different mass spec machines.| Try ESI |
 |
|---|
| ChTry ESI |
|
|---|
| ArgC ESI |
|
|---|
| LysN ESI |
|
|---|
| TryLysC ESI |
|
|---|
| Try MALDI |
|
|---|
| ChTry MALDI |
|
|---|
| ArgC MALDI |
|
|---|
| LysN MALDI |
|
|---|
| TryLysC MALDI |
|
|---|
| Try LTQ |
|
|---|
| ChTry LTQ |
|
|---|
| ArgC LTQ |
|
|---|
| LysN LTQ |
|
|---|
| TryLysC LTQ |
|
|---|
| Try MSlow |
|
|---|
| ChTry MSlow |
|
|---|
| ArgC MSlow |
|
|---|
| LysN MSlow |
|
|---|
| TryLysC MSlow |
|
|---|
| Try MShigh |
|
|---|
| ChTry MShigh |
|
|---|
| ArgC MShigh |
|
|---|
| LysN MShigh |
|
|---|
| TryLysC MShigh |
|
|---|
General Statistics
Number of major isoforms |
Number of additional isoforms |
Number of all proteins |
Number of amino acids |
Min. Seq. Length |
Max. Seq. Length |
Avg. Seq. Length |
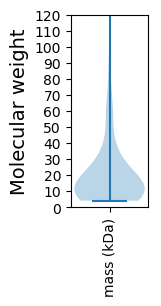
Avg. Mol. Weight |
|---|---|---|---|---|---|---|---|
0 |
15513 |
37 |
1287 |
196.4 |
21.69 |
Amino acid frequency
Ala |
Cys |
Asp |
Glu |
Phe |
Gly |
His |
Ile |
Lys |
Leu |
|---|---|---|---|---|---|---|---|---|---|
10.411 ± 0.684 | 0.993 ± 0.166 |
5.209 ± 0.201 | 6.311 ± 0.33 |
3.913 ± 0.161 | 7.252 ± 0.241 |
1.508 ± 0.189 | 5.628 ± 0.178 |
6.233 ± 0.391 | 7.909 ± 0.258 |
Met |
Asn |
Gln |
Pro |
Arg |
Ser |
Thr |
Val |
Trp |
Tyr |
|---|---|---|---|---|---|---|---|---|---|
2.372 ± 0.175 | 4.809 ± 0.176 |
4.39 ± 0.276 | 4.184 ± 0.398 |
5.073 ± 0.16 | 6.466 ± 0.331 |
5.995 ± 0.365 | 6.53 ± 0.273 |
1.612 ± 0.147 | 3.204 ± 0.202 |
Most of the basic statistics you can see at this page can be downloaded from this CSV file
See this proteome in:

Proteome-pI is available under Creative Commons Attribution-NoDerivs license, for more details see here
| Reference: Kozlowski LP. Proteome-pI 2.0: Proteome Isoelectric Point Database Update. Nucleic Acids Res. 2021, doi: 10.1093/nar/gkab944 | Contact: Lukasz P. Kozlowski |