Mycobacterium phage Nitzel
Taxonomy: Viruses; Duplodnaviria; Heunggongvirae; Uroviricota; Caudoviricetes; Caudovirales; Siphoviridae; Cheoctovirus; unclassified Cheoctovirus
Average proteome isoelectric point is 5.94
Get precalculated fractions of proteins
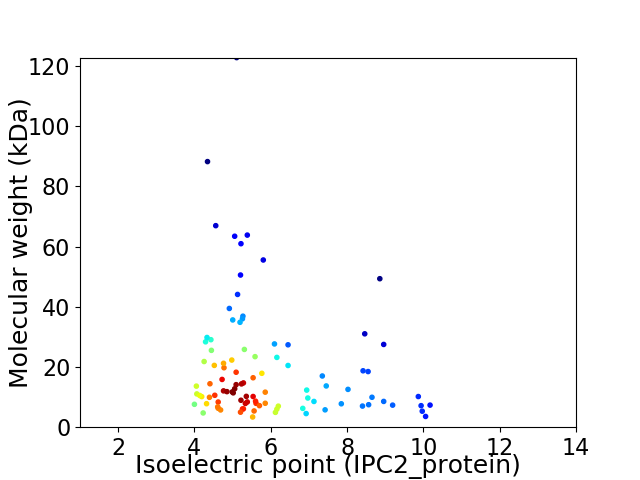
Virtual 2D-PAGE plot for 98 proteins (isoelectric point calculated using IPC2_protein)
Get csv file with sequences according to given criteria:
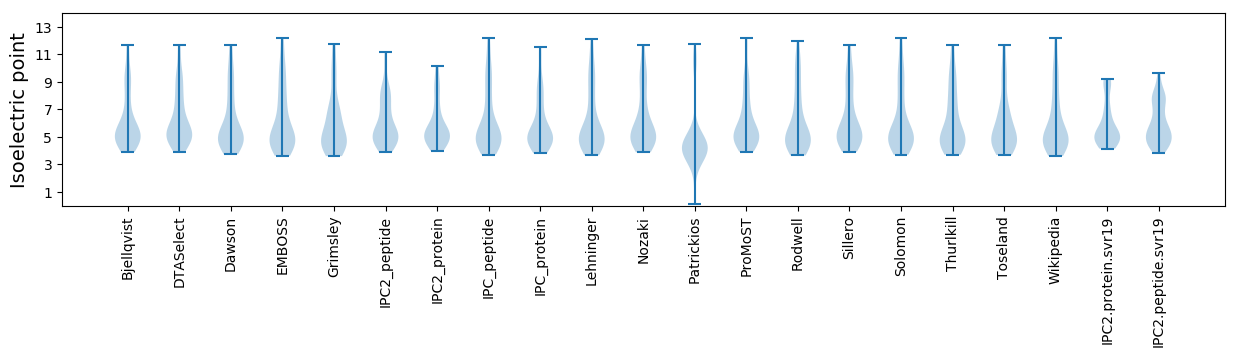
* You can choose from 21 different methods for calculating isoelectric point
Summary statistics related to proteome-wise predictions
Protein with the lowest isoelectric point:
>tr|A0A5J6T5A1|A0A5J6T5A1_9CAUD Uncharacterized protein OS=Mycobacterium phage Nitzel OX=2652404 GN=82 PE=4 SV=1
MM1 pKa = 7.51SHH3 pKa = 6.63EE4 pKa = 4.44PDD6 pKa = 3.71EE7 pKa = 4.75IEE9 pKa = 5.63PISQMEE15 pKa = 4.2LEE17 pKa = 4.32ILANSGDD24 pKa = 4.27LEE26 pKa = 4.46LATQVGEE33 pKa = 3.85IARR36 pKa = 11.84WAFTQTVEE44 pKa = 4.48SLCTLLCLPPEE55 pKa = 4.38VAEE58 pKa = 4.0QMVNEE63 pKa = 4.22WFLRR67 pKa = 3.83
MM1 pKa = 7.51SHH3 pKa = 6.63EE4 pKa = 4.44PDD6 pKa = 3.71EE7 pKa = 4.75IEE9 pKa = 5.63PISQMEE15 pKa = 4.2LEE17 pKa = 4.32ILANSGDD24 pKa = 4.27LEE26 pKa = 4.46LATQVGEE33 pKa = 3.85IARR36 pKa = 11.84WAFTQTVEE44 pKa = 4.48SLCTLLCLPPEE55 pKa = 4.38VAEE58 pKa = 4.0QMVNEE63 pKa = 4.22WFLRR67 pKa = 3.83
Molecular weight: 7.6 kDa
Isoelectric point according different methods:
Protein with the highest isoelectric point:
>tr|A0A5J6T3C0|A0A5J6T3C0_9CAUD Uncharacterized protein OS=Mycobacterium phage Nitzel OX=2652404 GN=48 PE=4 SV=1
MM1 pKa = 7.45SRR3 pKa = 11.84PNGQIILTSEE13 pKa = 3.9MYY15 pKa = 10.33NRR17 pKa = 11.84RR18 pKa = 11.84SDD20 pKa = 3.4AKK22 pKa = 9.44RR23 pKa = 11.84AARR26 pKa = 11.84MFIRR30 pKa = 11.84EE31 pKa = 4.26VFSSIVFRR39 pKa = 11.84YY40 pKa = 9.03YY41 pKa = 10.68NRR43 pKa = 11.84DD44 pKa = 3.14GEE46 pKa = 4.34RR47 pKa = 11.84VQEE50 pKa = 4.72NIRR53 pKa = 11.84DD54 pKa = 3.64WLRR57 pKa = 11.84RR58 pKa = 3.57
MM1 pKa = 7.45SRR3 pKa = 11.84PNGQIILTSEE13 pKa = 3.9MYY15 pKa = 10.33NRR17 pKa = 11.84RR18 pKa = 11.84SDD20 pKa = 3.4AKK22 pKa = 9.44RR23 pKa = 11.84AARR26 pKa = 11.84MFIRR30 pKa = 11.84EE31 pKa = 4.26VFSSIVFRR39 pKa = 11.84YY40 pKa = 9.03YY41 pKa = 10.68NRR43 pKa = 11.84DD44 pKa = 3.14GEE46 pKa = 4.34RR47 pKa = 11.84VQEE50 pKa = 4.72NIRR53 pKa = 11.84DD54 pKa = 3.64WLRR57 pKa = 11.84RR58 pKa = 3.57
Molecular weight: 7.16 kDa
Isoelectric point according different methods:
Peptides (in silico digests for buttom-up proteomics)
Below you can find in silico digests of the whole proteome with Trypsin, Chymotrypsin, Trypsin+LysC, LysN, ArgC proteases suitable for different mass spec machines.| Try ESI |
 |
|---|
| ChTry ESI |
|
|---|
| ArgC ESI |
|
|---|
| LysN ESI |
|
|---|
| TryLysC ESI |
|
|---|
| Try MALDI |
|
|---|
| ChTry MALDI |
|
|---|
| ArgC MALDI |
|
|---|
| LysN MALDI |
|
|---|
| TryLysC MALDI |
|
|---|
| Try LTQ |
|
|---|
| ChTry LTQ |
|
|---|
| ArgC LTQ |
|
|---|
| LysN LTQ |
|
|---|
| TryLysC LTQ |
|
|---|
| Try MSlow |
|
|---|
| ChTry MSlow |
|
|---|
| ArgC MSlow |
|
|---|
| LysN MSlow |
|
|---|
| TryLysC MSlow |
|
|---|
| Try MShigh |
|
|---|
| ChTry MShigh |
|
|---|
| ArgC MShigh |
|
|---|
| LysN MShigh |
|
|---|
| TryLysC MShigh |
|
|---|
General Statistics
Number of major isoforms |
Number of additional isoforms |
Number of all proteins |
Number of amino acids |
Min. Seq. Length |
Max. Seq. Length |
Avg. Seq. Length |
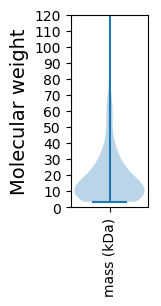
Avg. Mol. Weight |
|---|---|---|---|---|---|---|---|
0 |
17518 |
30 |
1213 |
178.8 |
19.54 |
Amino acid frequency
Ala |
Cys |
Asp |
Glu |
Phe |
Gly |
His |
Ile |
Lys |
Leu |
|---|---|---|---|---|---|---|---|---|---|
10.566 ± 0.493 | 1.233 ± 0.171 |
6.616 ± 0.238 | 5.982 ± 0.399 |
2.968 ± 0.191 | 8.854 ± 0.642 |
2.169 ± 0.165 | 4.515 ± 0.182 |
3.362 ± 0.187 | 7.227 ± 0.21 |
Met |
Asn |
Gln |
Pro |
Arg |
Ser |
Thr |
Val |
Trp |
Tyr |
|---|---|---|---|---|---|---|---|---|---|
2.283 ± 0.131 | 3.425 ± 0.18 |
6.011 ± 0.179 | 3.494 ± 0.216 |
6.713 ± 0.413 | 5.834 ± 0.304 |
6.513 ± 0.27 | 7.438 ± 0.272 |
2.352 ± 0.145 | 2.443 ± 0.179 |
Most of the basic statistics you can see at this page can be downloaded from this CSV file
See this proteome in:

Proteome-pI is available under Creative Commons Attribution-NoDerivs license, for more details see here
| Reference: Kozlowski LP. Proteome-pI 2.0: Proteome Isoelectric Point Database Update. Nucleic Acids Res. 2021, doi: 10.1093/nar/gkab944 | Contact: Lukasz P. Kozlowski |