Gordonia phage Tangerine
Taxonomy: Viruses; Duplodnaviria; Heunggongvirae; Uroviricota; Caudoviricetes; Caudovirales; Siphoviridae; Vividuovirus; unclassified Vividuovirus
Average proteome isoelectric point is 6.01
Get precalculated fractions of proteins
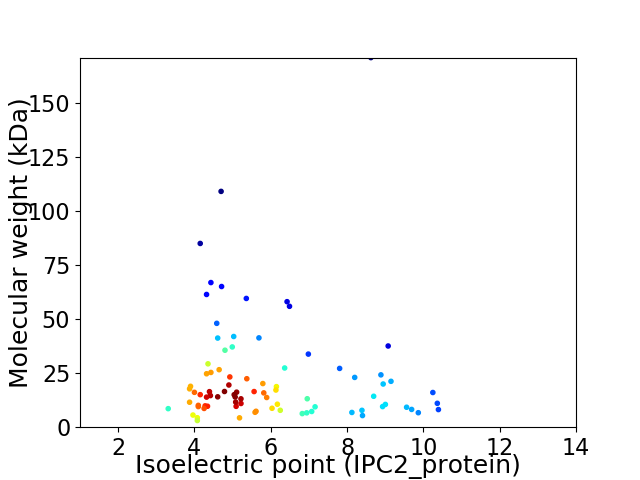
Virtual 2D-PAGE plot for 85 proteins (isoelectric point calculated using IPC2_protein)
Get csv file with sequences according to given criteria:
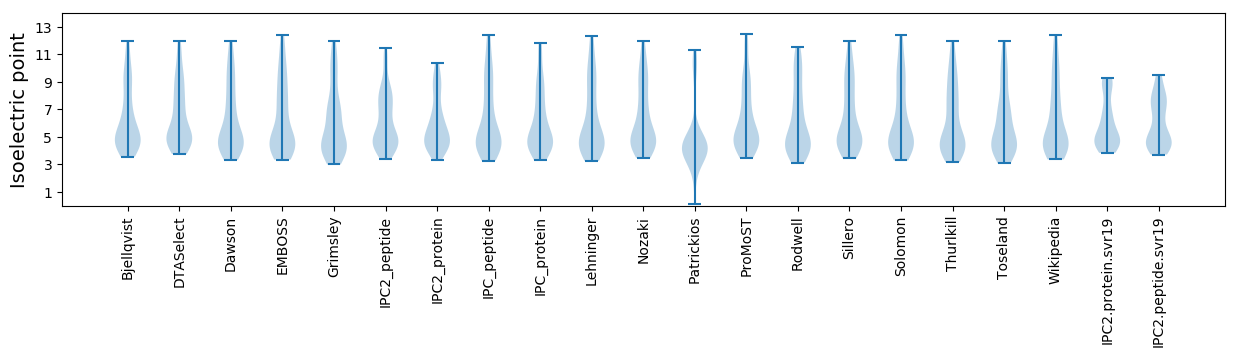
* You can choose from 21 different methods for calculating isoelectric point
Summary statistics related to proteome-wise predictions
Protein with the lowest isoelectric point:
>tr|A0A515ML18|A0A515ML18_9CAUD Uncharacterized protein OS=Gordonia phage Tangerine OX=2591120 GN=62 PE=4 SV=1
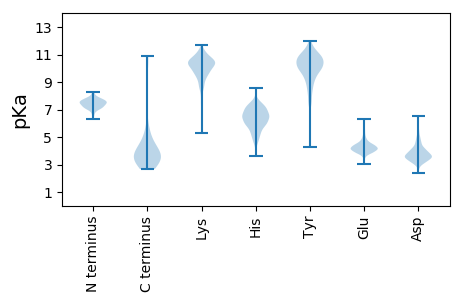
MM1 pKa = 7.09NACGAIAWLASIGSATVVCSLDD23 pKa = 3.52EE24 pKa = 4.45GHH26 pKa = 7.46DD27 pKa = 3.92GPHH30 pKa = 6.77RR31 pKa = 11.84DD32 pKa = 4.52DD33 pKa = 4.07YY34 pKa = 11.96LDD36 pKa = 4.06VEE38 pKa = 4.47WSGAA42 pKa = 3.42
MM1 pKa = 7.09NACGAIAWLASIGSATVVCSLDD23 pKa = 3.52EE24 pKa = 4.45GHH26 pKa = 7.46DD27 pKa = 3.92GPHH30 pKa = 6.77RR31 pKa = 11.84DD32 pKa = 4.52DD33 pKa = 4.07YY34 pKa = 11.96LDD36 pKa = 4.06VEE38 pKa = 4.47WSGAA42 pKa = 3.42
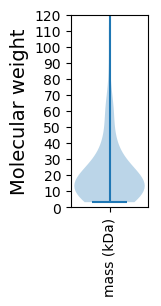
Molecular weight: 4.39 kDa
Isoelectric point according different methods:
Protein with the highest isoelectric point:
>tr|A0A515MKX0|A0A515MKX0_9CAUD Uncharacterized protein OS=Gordonia phage Tangerine OX=2591120 GN=14 PE=4 SV=1
MM1 pKa = 7.16GWLVFGPAFVVVRR14 pKa = 11.84IVKK17 pKa = 9.78IVEE20 pKa = 4.16DD21 pKa = 3.64ALSPKK26 pKa = 9.79RR27 pKa = 11.84RR28 pKa = 11.84RR29 pKa = 11.84EE30 pKa = 4.14LIRR33 pKa = 11.84QQTRR37 pKa = 11.84DD38 pKa = 3.48EE39 pKa = 4.16VAAAARR45 pKa = 11.84RR46 pKa = 11.84SEE48 pKa = 4.19EE49 pKa = 3.8YY50 pKa = 10.16RR51 pKa = 11.84RR52 pKa = 11.84TRR54 pKa = 11.84YY55 pKa = 10.12GLL57 pKa = 3.49
MM1 pKa = 7.16GWLVFGPAFVVVRR14 pKa = 11.84IVKK17 pKa = 9.78IVEE20 pKa = 4.16DD21 pKa = 3.64ALSPKK26 pKa = 9.79RR27 pKa = 11.84RR28 pKa = 11.84RR29 pKa = 11.84EE30 pKa = 4.14LIRR33 pKa = 11.84QQTRR37 pKa = 11.84DD38 pKa = 3.48EE39 pKa = 4.16VAAAARR45 pKa = 11.84RR46 pKa = 11.84SEE48 pKa = 4.19EE49 pKa = 3.8YY50 pKa = 10.16RR51 pKa = 11.84RR52 pKa = 11.84TRR54 pKa = 11.84YY55 pKa = 10.12GLL57 pKa = 3.49
Molecular weight: 6.72 kDa
Isoelectric point according different methods:
Peptides (in silico digests for buttom-up proteomics)
Below you can find in silico digests of the whole proteome with Trypsin, Chymotrypsin, Trypsin+LysC, LysN, ArgC proteases suitable for different mass spec machines.| Try ESI |
 |
|---|
| ChTry ESI |
|
|---|
| ArgC ESI |
|
|---|
| LysN ESI |
|
|---|
| TryLysC ESI |
|
|---|
| Try MALDI |
|
|---|
| ChTry MALDI |
|
|---|
| ArgC MALDI |
|
|---|
| LysN MALDI |
|
|---|
| TryLysC MALDI |
|
|---|
| Try LTQ |
|
|---|
| ChTry LTQ |
|
|---|
| ArgC LTQ |
|
|---|
| LysN LTQ |
|
|---|
| TryLysC LTQ |
|
|---|
| Try MSlow |
|
|---|
| ChTry MSlow |
|
|---|
| ArgC MSlow |
|
|---|
| LysN MSlow |
|
|---|
| TryLysC MSlow |
|
|---|
| Try MShigh |
|
|---|
| ChTry MShigh |
|
|---|
| ArgC MShigh |
|
|---|
| LysN MShigh |
|
|---|
| TryLysC MShigh |
|
|---|
General Statistics
Number of major isoforms |
Number of additional isoforms |
Number of all proteins |
Number of amino acids |
Min. Seq. Length |
Max. Seq. Length |
Avg. Seq. Length |
Avg. Mol. Weight |
|---|---|---|---|---|---|---|---|
0 |
18329 |
27 |
1671 |
215.6 |
23.36 |
Amino acid frequency
Ala |
Cys |
Asp |
Glu |
Phe |
Gly |
His |
Ile |
Lys |
Leu |
|---|---|---|---|---|---|---|---|---|---|
12.417 ± 0.376 | 0.84 ± 0.113 |
7.644 ± 0.48 | 5.434 ± 0.346 |
2.417 ± 0.164 | 8.828 ± 0.45 |
2.084 ± 0.198 | 4.392 ± 0.249 |
2.373 ± 0.163 | 7.545 ± 0.224 |
Met |
Asn |
Gln |
Pro |
Arg |
Ser |
Thr |
Val |
Trp |
Tyr |
|---|---|---|---|---|---|---|---|---|---|
2.128 ± 0.111 | 2.679 ± 0.158 |
6.241 ± 0.296 | 3.797 ± 0.154 |
7.464 ± 0.403 | 4.91 ± 0.292 |
6.547 ± 0.27 | 7.922 ± 0.241 |
2.117 ± 0.123 | 2.221 ± 0.145 |
Most of the basic statistics you can see at this page can be downloaded from this CSV file
See this proteome in:

Proteome-pI is available under Creative Commons Attribution-NoDerivs license, for more details see here
| Reference: Kozlowski LP. Proteome-pI 2.0: Proteome Isoelectric Point Database Update. Nucleic Acids Res. 2021, doi: 10.1093/nar/gkab944 | Contact: Lukasz P. Kozlowski |