Gordonia phage Vivi2
Taxonomy: Viruses; Duplodnaviria; Heunggongvirae; Uroviricota; Caudoviricetes; Caudovirales; Siphoviridae; Vividuovirus; Gordonia virus Vivi2
Average proteome isoelectric point is 5.99
Get precalculated fractions of proteins
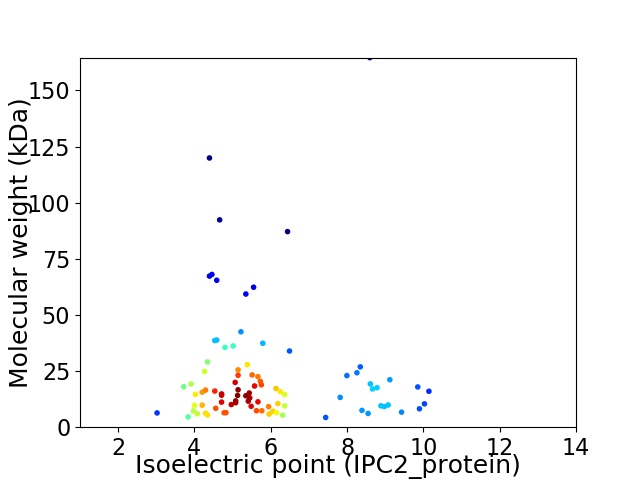
Virtual 2D-PAGE plot for 89 proteins (isoelectric point calculated using IPC2_protein)
Get csv file with sequences according to given criteria:
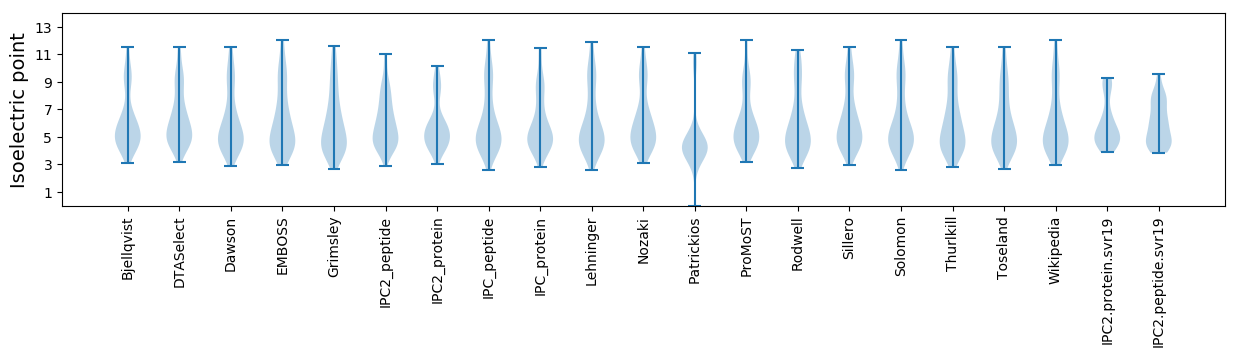
* You can choose from 21 different methods for calculating isoelectric point
Summary statistics related to proteome-wise predictions
Protein with the lowest isoelectric point:
>tr|A0A142K9W7|A0A142K9W7_9CAUD Uncharacterized protein OS=Gordonia phage Vivi2 OX=1821564 GN=68 PE=4 SV=1
MM1 pKa = 7.52SWTEE5 pKa = 3.81DD6 pKa = 3.54CNACGHH12 pKa = 5.69THH14 pKa = 7.4PDD16 pKa = 3.65EE17 pKa = 4.91CDD19 pKa = 3.81CPCGCTMHH27 pKa = 7.33PVDD30 pKa = 3.83TWDD33 pKa = 3.45MTEE36 pKa = 4.44LPGDD40 pKa = 3.66EE41 pKa = 4.19
MM1 pKa = 7.52SWTEE5 pKa = 3.81DD6 pKa = 3.54CNACGHH12 pKa = 5.69THH14 pKa = 7.4PDD16 pKa = 3.65EE17 pKa = 4.91CDD19 pKa = 3.81CPCGCTMHH27 pKa = 7.33PVDD30 pKa = 3.83TWDD33 pKa = 3.45MTEE36 pKa = 4.44LPGDD40 pKa = 3.66EE41 pKa = 4.19
Molecular weight: 4.57 kDa
Isoelectric point according different methods:
Protein with the highest isoelectric point:
>tr|A0A142K9R7|A0A142K9R7_9CAUD HNH endonuclease OS=Gordonia phage Vivi2 OX=1821564 GN=18 PE=4 SV=1
MM1 pKa = 7.26GWLLFGAVFIPVRR14 pKa = 11.84IAKK17 pKa = 9.9IIEE20 pKa = 4.48DD21 pKa = 3.61ALSPRR26 pKa = 11.84RR27 pKa = 11.84RR28 pKa = 11.84RR29 pKa = 11.84EE30 pKa = 3.9LIQQQTRR37 pKa = 11.84DD38 pKa = 3.68EE39 pKa = 4.24VAAAAEE45 pKa = 3.96RR46 pKa = 11.84SEE48 pKa = 4.23EE49 pKa = 3.96YY50 pKa = 10.34RR51 pKa = 11.84RR52 pKa = 11.84TRR54 pKa = 11.84YY55 pKa = 10.12GLL57 pKa = 3.49
MM1 pKa = 7.26GWLLFGAVFIPVRR14 pKa = 11.84IAKK17 pKa = 9.9IIEE20 pKa = 4.48DD21 pKa = 3.61ALSPRR26 pKa = 11.84RR27 pKa = 11.84RR28 pKa = 11.84RR29 pKa = 11.84EE30 pKa = 3.9LIQQQTRR37 pKa = 11.84DD38 pKa = 3.68EE39 pKa = 4.24VAAAAEE45 pKa = 3.96RR46 pKa = 11.84SEE48 pKa = 4.23EE49 pKa = 3.96YY50 pKa = 10.34RR51 pKa = 11.84RR52 pKa = 11.84TRR54 pKa = 11.84YY55 pKa = 10.12GLL57 pKa = 3.49
Molecular weight: 6.7 kDa
Isoelectric point according different methods:
Peptides (in silico digests for buttom-up proteomics)
Below you can find in silico digests of the whole proteome with Trypsin, Chymotrypsin, Trypsin+LysC, LysN, ArgC proteases suitable for different mass spec machines.| Try ESI |
 |
|---|
| ChTry ESI |
|
|---|
| ArgC ESI |
|
|---|
| LysN ESI |
|
|---|
| TryLysC ESI |
|
|---|
| Try MALDI |
|
|---|
| ChTry MALDI |
|
|---|
| ArgC MALDI |
|
|---|
| LysN MALDI |
|
|---|
| TryLysC MALDI |
|
|---|
| Try LTQ |
|
|---|
| ChTry LTQ |
|
|---|
| ArgC LTQ |
|
|---|
| LysN LTQ |
|
|---|
| TryLysC LTQ |
|
|---|
| Try MSlow |
|
|---|
| ChTry MSlow |
|
|---|
| ArgC MSlow |
|
|---|
| LysN MSlow |
|
|---|
| TryLysC MSlow |
|
|---|
| Try MShigh |
|
|---|
| ChTry MShigh |
|
|---|
| ArgC MShigh |
|
|---|
| LysN MShigh |
|
|---|
| TryLysC MShigh |
|
|---|
General Statistics
Number of major isoforms |
Number of additional isoforms |
Number of all proteins |
Number of amino acids |
Min. Seq. Length |
Max. Seq. Length |
Avg. Seq. Length |
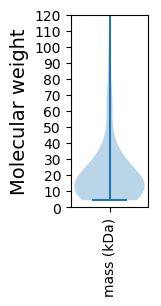
Avg. Mol. Weight |
|---|---|---|---|---|---|---|---|
0 |
18766 |
37 |
1603 |
210.9 |
22.95 |
Amino acid frequency
Ala |
Cys |
Asp |
Glu |
Phe |
Gly |
His |
Ile |
Lys |
Leu |
|---|---|---|---|---|---|---|---|---|---|
11.974 ± 0.389 | 0.837 ± 0.109 |
7.625 ± 0.458 | 5.611 ± 0.361 |
2.489 ± 0.168 | 8.681 ± 0.369 |
2.163 ± 0.18 | 4.497 ± 0.275 |
2.387 ± 0.207 | 7.386 ± 0.261 |
Met |
Asn |
Gln |
Pro |
Arg |
Ser |
Thr |
Val |
Trp |
Tyr |
|---|---|---|---|---|---|---|---|---|---|
2.185 ± 0.096 | 2.824 ± 0.188 |
6.139 ± 0.213 | 3.73 ± 0.183 |
7.647 ± 0.434 | 4.7 ± 0.221 |
6.741 ± 0.307 | 7.961 ± 0.265 |
2.126 ± 0.121 | 2.297 ± 0.143 |
Most of the basic statistics you can see at this page can be downloaded from this CSV file
See this proteome in:

Proteome-pI is available under Creative Commons Attribution-NoDerivs license, for more details see here
| Reference: Kozlowski LP. Proteome-pI 2.0: Proteome Isoelectric Point Database Update. Nucleic Acids Res. 2021, doi: 10.1093/nar/gkab944 | Contact: Lukasz P. Kozlowski |