Klebsiella pneumoniae IS53
Taxonomy: cellular organisms; Bacteria; Proteobacteria; Gammaproteobacteria; Enterobacterales; Enterobacteriaceae; Klebsiella; Klebsiella pneumoniae
Average proteome isoelectric point is 6.82
Get precalculated fractions of proteins
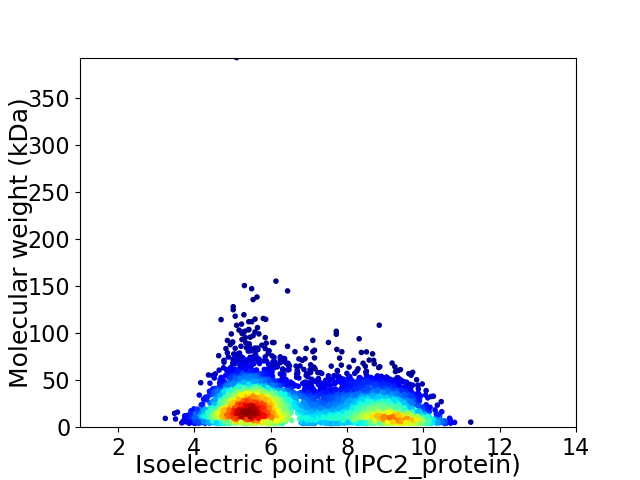
Virtual 2D-PAGE plot for 5308 proteins (isoelectric point calculated using IPC2_protein)
Get csv file with sequences according to given criteria:
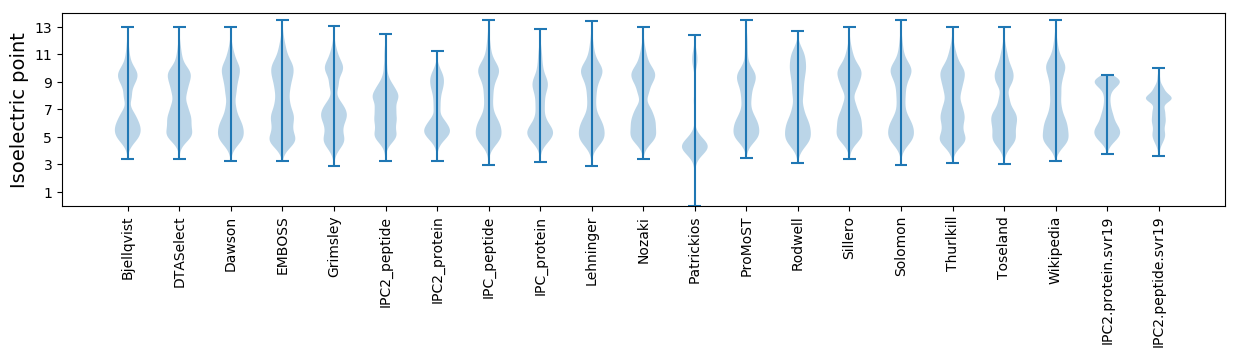
* You can choose from 21 different methods for calculating isoelectric point
Summary statistics related to proteome-wise predictions
Protein with the lowest isoelectric point:
>tr|W1EAL9|W1EAL9_KLEPN Adenylosuccinate lyase OS=Klebsiella pneumoniae IS53 OX=1432554 PE=3 SV=1
MM1 pKa = 7.66EE2 pKa = 5.6NGFFTVDD9 pKa = 3.61YY10 pKa = 9.89EE11 pKa = 4.78SMAGVVTTLVAHH23 pKa = 6.84NIFSPFSQEE32 pKa = 3.98IDD34 pKa = 3.51DD35 pKa = 4.75LPFTFVTPLGAQYY48 pKa = 11.33DD49 pKa = 4.11DD50 pKa = 4.16VVTHH54 pKa = 6.32FSKK57 pKa = 11.21SPFAA61 pKa = 5.54
MM1 pKa = 7.66EE2 pKa = 5.6NGFFTVDD9 pKa = 3.61YY10 pKa = 9.89EE11 pKa = 4.78SMAGVVTTLVAHH23 pKa = 6.84NIFSPFSQEE32 pKa = 3.98IDD34 pKa = 3.51DD35 pKa = 4.75LPFTFVTPLGAQYY48 pKa = 11.33DD49 pKa = 4.11DD50 pKa = 4.16VVTHH54 pKa = 6.32FSKK57 pKa = 11.21SPFAA61 pKa = 5.54
Molecular weight: 6.78 kDa
Isoelectric point according different methods:
Protein with the highest isoelectric point:
>tr|W1EFY5|W1EFY5_KLEPN Ribosome-binding factor A OS=Klebsiella pneumoniae IS53 OX=1432554 GN=rbfA PE=3 SV=1
MM1 pKa = 7.45KK2 pKa = 9.51RR3 pKa = 11.84TFQPSVLKK11 pKa = 10.6RR12 pKa = 11.84NRR14 pKa = 11.84SHH16 pKa = 7.16GFRR19 pKa = 11.84ARR21 pKa = 11.84MATKK25 pKa = 10.4NGRR28 pKa = 11.84QVLARR33 pKa = 11.84RR34 pKa = 11.84RR35 pKa = 11.84AKK37 pKa = 10.22GRR39 pKa = 11.84ARR41 pKa = 11.84LTVSKK46 pKa = 10.99
MM1 pKa = 7.45KK2 pKa = 9.51RR3 pKa = 11.84TFQPSVLKK11 pKa = 10.6RR12 pKa = 11.84NRR14 pKa = 11.84SHH16 pKa = 7.16GFRR19 pKa = 11.84ARR21 pKa = 11.84MATKK25 pKa = 10.4NGRR28 pKa = 11.84QVLARR33 pKa = 11.84RR34 pKa = 11.84RR35 pKa = 11.84AKK37 pKa = 10.22GRR39 pKa = 11.84ARR41 pKa = 11.84LTVSKK46 pKa = 10.99
Molecular weight: 5.38 kDa
Isoelectric point according different methods:
Peptides (in silico digests for buttom-up proteomics)
Below you can find in silico digests of the whole proteome with Trypsin, Chymotrypsin, Trypsin+LysC, LysN, ArgC proteases suitable for different mass spec machines.| Try ESI |
 |
|---|
| ChTry ESI |
|
|---|
| ArgC ESI |
|
|---|
| LysN ESI |
|
|---|
| TryLysC ESI |
|
|---|
| Try MALDI |
|
|---|
| ChTry MALDI |
|
|---|
| ArgC MALDI |
|
|---|
| LysN MALDI |
|
|---|
| TryLysC MALDI |
|
|---|
| Try LTQ |
|
|---|
| ChTry LTQ |
|
|---|
| ArgC LTQ |
|
|---|
| LysN LTQ |
|
|---|
| TryLysC LTQ |
|
|---|
| Try MSlow |
|
|---|
| ChTry MSlow |
|
|---|
| ArgC MSlow |
|
|---|
| LysN MSlow |
|
|---|
| TryLysC MSlow |
|
|---|
| Try MShigh |
|
|---|
| ChTry MShigh |
|
|---|
| ArgC MShigh |
|
|---|
| LysN MShigh |
|
|---|
| TryLysC MShigh |
|
|---|
General Statistics
Number of major isoforms |
Number of additional isoforms |
Number of all proteins |
Number of amino acids |
Min. Seq. Length |
Max. Seq. Length |
Avg. Seq. Length |
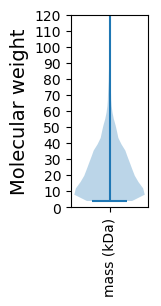
Avg. Mol. Weight |
|---|---|---|---|---|---|---|---|
0 |
1145449 |
37 |
3698 |
215.8 |
23.93 |
Amino acid frequency
Ala |
Cys |
Asp |
Glu |
Phe |
Gly |
His |
Ile |
Lys |
Leu |
|---|---|---|---|---|---|---|---|---|---|
9.768 ± 0.041 | 1.115 ± 0.015 |
5.165 ± 0.03 | 5.495 ± 0.036 |
4.015 ± 0.029 | 7.442 ± 0.032 |
2.359 ± 0.02 | 5.844 ± 0.03 |
4.253 ± 0.031 | 10.605 ± 0.049 |
Met |
Asn |
Gln |
Pro |
Arg |
Ser |
Thr |
Val |
Trp |
Tyr |
|---|---|---|---|---|---|---|---|---|---|
2.89 ± 0.019 | 3.627 ± 0.028 |
4.492 ± 0.027 | 4.415 ± 0.029 |
5.958 ± 0.037 | 5.875 ± 0.034 |
5.24 ± 0.031 | 6.994 ± 0.03 |
1.562 ± 0.019 | 2.884 ± 0.022 |
Most of the basic statistics you can see at this page can be downloaded from this CSV file
See this proteome in:

Proteome-pI is available under Creative Commons Attribution-NoDerivs license, for more details see here
| Reference: Kozlowski LP. Proteome-pI 2.0: Proteome Isoelectric Point Database Update. Nucleic Acids Res. 2021, doi: 10.1093/nar/gkab944 | Contact: Lukasz P. Kozlowski |