Sphingomonas gellani
Taxonomy: cellular organisms; Bacteria; Proteobacteria; Alphaproteobacteria; Sphingomonadales; Sphingomonadaceae; Sphingomonas
Average proteome isoelectric point is 6.8
Get precalculated fractions of proteins
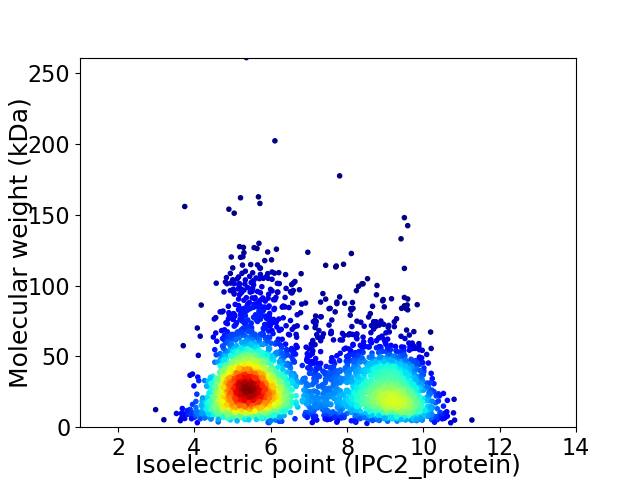
Virtual 2D-PAGE plot for 3624 proteins (isoelectric point calculated using IPC2_protein)
Get csv file with sequences according to given criteria:
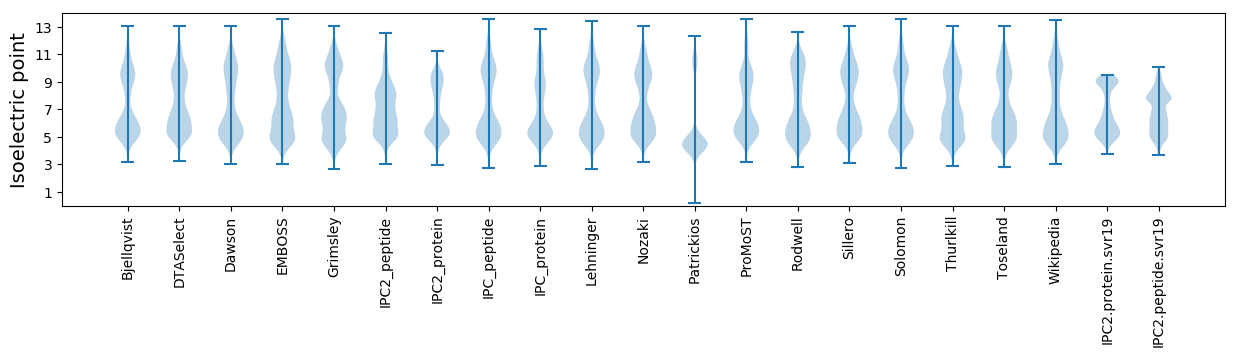
* You can choose from 21 different methods for calculating isoelectric point
Summary statistics related to proteome-wise predictions
Protein with the lowest isoelectric point:
>tr|A0A1H8HWX6|A0A1H8HWX6_9SPHN N-acetylgalactosamine-N N'-diacetylbacillosaminyl-diphospho-undecaprenol 4-alpha-N-acetylgalactosaminyltransferase OS=Sphingomonas gellani OX=1166340 GN=SAMN05192583_3131 PE=4 SV=1
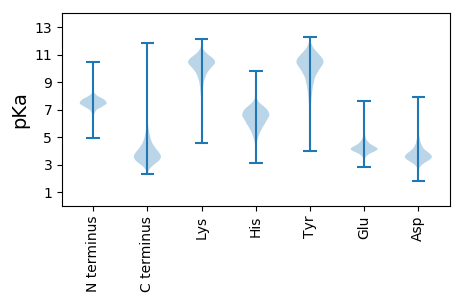
MM1 pKa = 7.81IYY3 pKa = 10.43YY4 pKa = 10.27LDD6 pKa = 3.64VALTQSGIDD15 pKa = 3.5WANQVPIPTSMTKK28 pKa = 10.43AEE30 pKa = 4.19YY31 pKa = 9.98DD32 pKa = 3.6ALPDD36 pKa = 3.18KK37 pKa = 10.79TVFVRR42 pKa = 11.84DD43 pKa = 4.17GYY45 pKa = 9.8TIDD48 pKa = 4.09LSEE51 pKa = 4.3GTSTGFAYY59 pKa = 10.31EE60 pKa = 4.67DD61 pKa = 3.12IVGRR65 pKa = 11.84TVNQIRR71 pKa = 11.84GLFPDD76 pKa = 3.41EE77 pKa = 4.63NGDD80 pKa = 3.62YY81 pKa = 10.68DD82 pKa = 3.56HH83 pKa = 7.44TYY85 pKa = 11.3ARR87 pKa = 11.84VHH89 pKa = 5.58VAGAGDD95 pKa = 3.64FTVIGSSAGEE105 pKa = 3.99DD106 pKa = 3.7LYY108 pKa = 11.53GGTGNDD114 pKa = 3.29TLYY117 pKa = 11.16DD118 pKa = 3.74GGNAGFEE125 pKa = 4.28YY126 pKa = 10.55EE127 pKa = 4.28HH128 pKa = 7.51DD129 pKa = 4.15GLHH132 pKa = 6.63GGAGDD137 pKa = 3.55DD138 pKa = 3.42TYY140 pKa = 11.58YY141 pKa = 9.52ITGVDD146 pKa = 3.34SSVTEE151 pKa = 3.97KK152 pKa = 10.88AGEE155 pKa = 4.28GFDD158 pKa = 4.16RR159 pKa = 11.84VYY161 pKa = 11.65ADD163 pKa = 5.35GFFQLYY169 pKa = 8.96PDD171 pKa = 4.21SEE173 pKa = 4.74VEE175 pKa = 4.02FVKK178 pKa = 10.78ISGEE182 pKa = 3.92YY183 pKa = 10.04AQAFGNNLANIMVGSDD199 pKa = 3.45QPSIIAGEE207 pKa = 4.4GGNDD211 pKa = 3.51TLRR214 pKa = 11.84SDD216 pKa = 3.87GADD219 pKa = 2.94TVFEE223 pKa = 4.42GGVGNDD229 pKa = 3.28AMRR232 pKa = 11.84GGAGVDD238 pKa = 3.06VFLYY242 pKa = 10.36YY243 pKa = 10.76GKK245 pKa = 10.47EE246 pKa = 4.06DD247 pKa = 3.5GRR249 pKa = 11.84DD250 pKa = 3.35TISRR254 pKa = 11.84FGKK257 pKa = 10.21EE258 pKa = 4.03DD259 pKa = 3.5VLVTTSKK266 pKa = 10.65IADD269 pKa = 3.51ANGDD273 pKa = 3.84NIITFGSNKK282 pKa = 10.15ALDD285 pKa = 3.85FTATSSVRR293 pKa = 11.84ITDD296 pKa = 3.53DD297 pKa = 2.63TGATVKK303 pKa = 10.74ALEE306 pKa = 4.07YY307 pKa = 10.96DD308 pKa = 3.75GAFTDD313 pKa = 4.82GGTTYY318 pKa = 10.9YY319 pKa = 10.48VYY321 pKa = 11.16SRR323 pKa = 11.84VGSSAGVDD331 pKa = 3.37SALGSGLVTYY341 pKa = 8.6YY342 pKa = 11.04AQYY345 pKa = 10.32QQ346 pKa = 3.39
MM1 pKa = 7.81IYY3 pKa = 10.43YY4 pKa = 10.27LDD6 pKa = 3.64VALTQSGIDD15 pKa = 3.5WANQVPIPTSMTKK28 pKa = 10.43AEE30 pKa = 4.19YY31 pKa = 9.98DD32 pKa = 3.6ALPDD36 pKa = 3.18KK37 pKa = 10.79TVFVRR42 pKa = 11.84DD43 pKa = 4.17GYY45 pKa = 9.8TIDD48 pKa = 4.09LSEE51 pKa = 4.3GTSTGFAYY59 pKa = 10.31EE60 pKa = 4.67DD61 pKa = 3.12IVGRR65 pKa = 11.84TVNQIRR71 pKa = 11.84GLFPDD76 pKa = 3.41EE77 pKa = 4.63NGDD80 pKa = 3.62YY81 pKa = 10.68DD82 pKa = 3.56HH83 pKa = 7.44TYY85 pKa = 11.3ARR87 pKa = 11.84VHH89 pKa = 5.58VAGAGDD95 pKa = 3.64FTVIGSSAGEE105 pKa = 3.99DD106 pKa = 3.7LYY108 pKa = 11.53GGTGNDD114 pKa = 3.29TLYY117 pKa = 11.16DD118 pKa = 3.74GGNAGFEE125 pKa = 4.28YY126 pKa = 10.55EE127 pKa = 4.28HH128 pKa = 7.51DD129 pKa = 4.15GLHH132 pKa = 6.63GGAGDD137 pKa = 3.55DD138 pKa = 3.42TYY140 pKa = 11.58YY141 pKa = 9.52ITGVDD146 pKa = 3.34SSVTEE151 pKa = 3.97KK152 pKa = 10.88AGEE155 pKa = 4.28GFDD158 pKa = 4.16RR159 pKa = 11.84VYY161 pKa = 11.65ADD163 pKa = 5.35GFFQLYY169 pKa = 8.96PDD171 pKa = 4.21SEE173 pKa = 4.74VEE175 pKa = 4.02FVKK178 pKa = 10.78ISGEE182 pKa = 3.92YY183 pKa = 10.04AQAFGNNLANIMVGSDD199 pKa = 3.45QPSIIAGEE207 pKa = 4.4GGNDD211 pKa = 3.51TLRR214 pKa = 11.84SDD216 pKa = 3.87GADD219 pKa = 2.94TVFEE223 pKa = 4.42GGVGNDD229 pKa = 3.28AMRR232 pKa = 11.84GGAGVDD238 pKa = 3.06VFLYY242 pKa = 10.36YY243 pKa = 10.76GKK245 pKa = 10.47EE246 pKa = 4.06DD247 pKa = 3.5GRR249 pKa = 11.84DD250 pKa = 3.35TISRR254 pKa = 11.84FGKK257 pKa = 10.21EE258 pKa = 4.03DD259 pKa = 3.5VLVTTSKK266 pKa = 10.65IADD269 pKa = 3.51ANGDD273 pKa = 3.84NIITFGSNKK282 pKa = 10.15ALDD285 pKa = 3.85FTATSSVRR293 pKa = 11.84ITDD296 pKa = 3.53DD297 pKa = 2.63TGATVKK303 pKa = 10.74ALEE306 pKa = 4.07YY307 pKa = 10.96DD308 pKa = 3.75GAFTDD313 pKa = 4.82GGTTYY318 pKa = 10.9YY319 pKa = 10.48VYY321 pKa = 11.16SRR323 pKa = 11.84VGSSAGVDD331 pKa = 3.37SALGSGLVTYY341 pKa = 8.6YY342 pKa = 11.04AQYY345 pKa = 10.32QQ346 pKa = 3.39
Molecular weight: 36.68 kDa
Isoelectric point according different methods:
Protein with the highest isoelectric point:
>tr|A0A1H7Y3I2|A0A1H7Y3I2_9SPHN Tape measure domain-containing protein OS=Sphingomonas gellani OX=1166340 GN=SAMN05192583_0072 PE=4 SV=1
MM1 pKa = 7.45KK2 pKa = 9.61RR3 pKa = 11.84TFQPSNLVRR12 pKa = 11.84ARR14 pKa = 11.84RR15 pKa = 11.84HH16 pKa = 4.58GFRR19 pKa = 11.84SRR21 pKa = 11.84MATVGGRR28 pKa = 11.84AVIRR32 pKa = 11.84ARR34 pKa = 11.84RR35 pKa = 11.84ARR37 pKa = 11.84GRR39 pKa = 11.84KK40 pKa = 9.02KK41 pKa = 10.61LSAA44 pKa = 4.03
MM1 pKa = 7.45KK2 pKa = 9.61RR3 pKa = 11.84TFQPSNLVRR12 pKa = 11.84ARR14 pKa = 11.84RR15 pKa = 11.84HH16 pKa = 4.58GFRR19 pKa = 11.84SRR21 pKa = 11.84MATVGGRR28 pKa = 11.84AVIRR32 pKa = 11.84ARR34 pKa = 11.84RR35 pKa = 11.84ARR37 pKa = 11.84GRR39 pKa = 11.84KK40 pKa = 9.02KK41 pKa = 10.61LSAA44 pKa = 4.03
Molecular weight: 5.07 kDa
Isoelectric point according different methods:
Peptides (in silico digests for buttom-up proteomics)
Below you can find in silico digests of the whole proteome with Trypsin, Chymotrypsin, Trypsin+LysC, LysN, ArgC proteases suitable for different mass spec machines.| Try ESI |
 |
|---|
| ChTry ESI |
|
|---|
| ArgC ESI |
|
|---|
| LysN ESI |
|
|---|
| TryLysC ESI |
|
|---|
| Try MALDI |
|
|---|
| ChTry MALDI |
|
|---|
| ArgC MALDI |
|
|---|
| LysN MALDI |
|
|---|
| TryLysC MALDI |
|
|---|
| Try LTQ |
|
|---|
| ChTry LTQ |
|
|---|
| ArgC LTQ |
|
|---|
| LysN LTQ |
|
|---|
| TryLysC LTQ |
|
|---|
| Try MSlow |
|
|---|
| ChTry MSlow |
|
|---|
| ArgC MSlow |
|
|---|
| LysN MSlow |
|
|---|
| TryLysC MSlow |
|
|---|
| Try MShigh |
|
|---|
| ChTry MShigh |
|
|---|
| ArgC MShigh |
|
|---|
| LysN MShigh |
|
|---|
| TryLysC MShigh |
|
|---|
General Statistics
Number of major isoforms |
Number of additional isoforms |
Number of all proteins |
Number of amino acids |
Min. Seq. Length |
Max. Seq. Length |
Avg. Seq. Length |
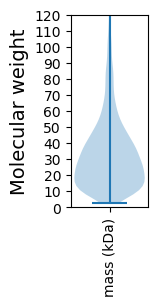
Avg. Mol. Weight |
|---|---|---|---|---|---|---|---|
0 |
1151458 |
24 |
2463 |
317.7 |
34.16 |
Amino acid frequency
Ala |
Cys |
Asp |
Glu |
Phe |
Gly |
His |
Ile |
Lys |
Leu |
|---|---|---|---|---|---|---|---|---|---|
13.852 ± 0.063 | 0.727 ± 0.013 |
6.171 ± 0.031 | 4.772 ± 0.041 |
3.343 ± 0.025 | 9.185 ± 0.043 |
1.978 ± 0.022 | 4.443 ± 0.025 |
2.44 ± 0.03 | 9.733 ± 0.045 |
Met |
Asn |
Gln |
Pro |
Arg |
Ser |
Thr |
Val |
Trp |
Tyr |
|---|---|---|---|---|---|---|---|---|---|
2.282 ± 0.022 | 2.441 ± 0.036 |
5.547 ± 0.038 | 3.118 ± 0.025 |
7.955 ± 0.045 | 5.126 ± 0.032 |
5.657 ± 0.037 | 7.624 ± 0.032 |
1.457 ± 0.019 | 2.149 ± 0.025 |
Most of the basic statistics you can see at this page can be downloaded from this CSV file
See this proteome in:

Proteome-pI is available under Creative Commons Attribution-NoDerivs license, for more details see here
| Reference: Kozlowski LP. Proteome-pI 2.0: Proteome Isoelectric Point Database Update. Nucleic Acids Res. 2021, doi: 10.1093/nar/gkab944 | Contact: Lukasz P. Kozlowski |