Mycobacterium phage DD5
Taxonomy: Viruses; Duplodnaviria; Heunggongvirae; Uroviricota; Caudoviricetes; Caudovirales; Siphoviridae; Fromanvirus; unclassified Fromanvirus
Average proteome isoelectric point is 6.14
Get precalculated fractions of proteins
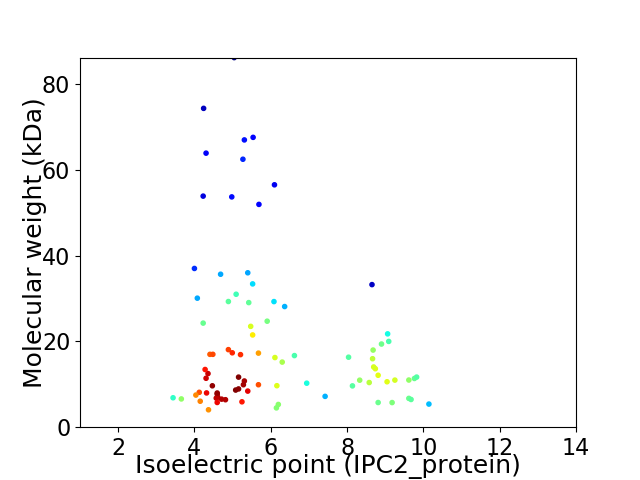
Virtual 2D-PAGE plot for 87 proteins (isoelectric point calculated using IPC2_protein)
Get csv file with sequences according to given criteria:
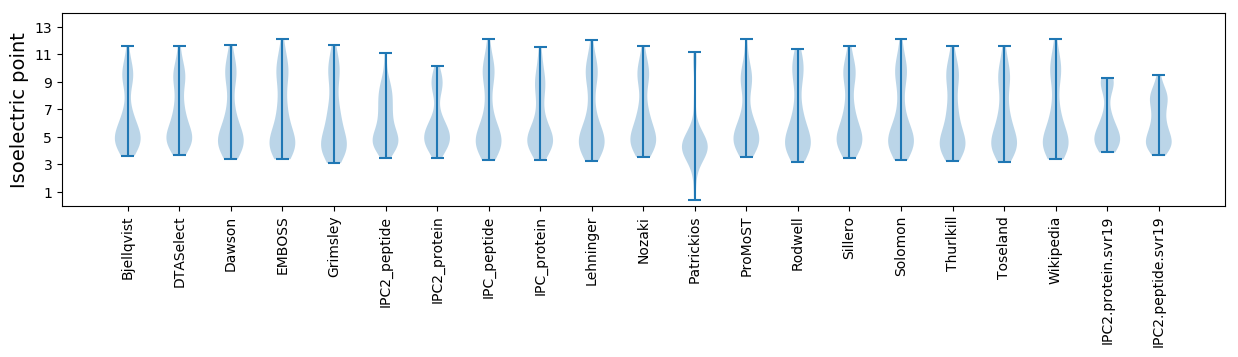
* You can choose from 21 different methods for calculating isoelectric point
Summary statistics related to proteome-wise predictions
Protein with the lowest isoelectric point:
>tr|B3VH46|B3VH46_9CAUD Uncharacterized protein OS=Mycobacterium phage DD5 OX=540064 GN=64 PE=4 SV=1
MM1 pKa = 7.35PQTVHH6 pKa = 6.12VLPVDD11 pKa = 3.73DD12 pKa = 5.94LIEE15 pKa = 6.03HH16 pKa = 6.92EE17 pKa = 5.93DD18 pKa = 3.34IGGDD22 pKa = 3.9CVCGPEE28 pKa = 4.14IEE30 pKa = 4.64PVFDD34 pKa = 5.12ADD36 pKa = 4.79GACGWVITHH45 pKa = 6.86HH46 pKa = 6.49SLDD49 pKa = 3.22GRR51 pKa = 11.84EE52 pKa = 3.86RR53 pKa = 11.84FEE55 pKa = 3.97
MM1 pKa = 7.35PQTVHH6 pKa = 6.12VLPVDD11 pKa = 3.73DD12 pKa = 5.94LIEE15 pKa = 6.03HH16 pKa = 6.92EE17 pKa = 5.93DD18 pKa = 3.34IGGDD22 pKa = 3.9CVCGPEE28 pKa = 4.14IEE30 pKa = 4.64PVFDD34 pKa = 5.12ADD36 pKa = 4.79GACGWVITHH45 pKa = 6.86HH46 pKa = 6.49SLDD49 pKa = 3.22GRR51 pKa = 11.84EE52 pKa = 3.86RR53 pKa = 11.84FEE55 pKa = 3.97
Molecular weight: 6.06 kDa
Isoelectric point according different methods:
Protein with the highest isoelectric point:
>tr|B3VH23|B3VH23_9CAUD Uncharacterized protein OS=Mycobacterium phage DD5 OX=540064 GN=41 PE=4 SV=1
MM1 pKa = 7.86RR2 pKa = 11.84EE3 pKa = 3.65LWGNDD8 pKa = 2.41ARR10 pKa = 11.84KK11 pKa = 8.79WLIRR15 pKa = 11.84KK16 pKa = 9.05SPHH19 pKa = 3.88TQEE22 pKa = 5.54RR23 pKa = 11.84IVFPSVGSFYY33 pKa = 11.27GVITFHH39 pKa = 7.49PDD41 pKa = 3.05YY42 pKa = 10.5EE43 pKa = 4.37SARR46 pKa = 11.84ADD48 pKa = 4.76FIRR51 pKa = 11.84QTRR54 pKa = 11.84RR55 pKa = 11.84PP56 pKa = 3.6
MM1 pKa = 7.86RR2 pKa = 11.84EE3 pKa = 3.65LWGNDD8 pKa = 2.41ARR10 pKa = 11.84KK11 pKa = 8.79WLIRR15 pKa = 11.84KK16 pKa = 9.05SPHH19 pKa = 3.88TQEE22 pKa = 5.54RR23 pKa = 11.84IVFPSVGSFYY33 pKa = 11.27GVITFHH39 pKa = 7.49PDD41 pKa = 3.05YY42 pKa = 10.5EE43 pKa = 4.37SARR46 pKa = 11.84ADD48 pKa = 4.76FIRR51 pKa = 11.84QTRR54 pKa = 11.84RR55 pKa = 11.84PP56 pKa = 3.6
Molecular weight: 6.72 kDa
Isoelectric point according different methods:
Peptides (in silico digests for buttom-up proteomics)
Below you can find in silico digests of the whole proteome with Trypsin, Chymotrypsin, Trypsin+LysC, LysN, ArgC proteases suitable for different mass spec machines.| Try ESI |
 |
|---|
| ChTry ESI |
|
|---|
| ArgC ESI |
|
|---|
| LysN ESI |
|
|---|
| TryLysC ESI |
|
|---|
| Try MALDI |
|
|---|
| ChTry MALDI |
|
|---|
| ArgC MALDI |
|
|---|
| LysN MALDI |
|
|---|
| TryLysC MALDI |
|
|---|
| Try LTQ |
|
|---|
| ChTry LTQ |
|
|---|
| ArgC LTQ |
|
|---|
| LysN LTQ |
|
|---|
| TryLysC LTQ |
|
|---|
| Try MSlow |
|
|---|
| ChTry MSlow |
|
|---|
| ArgC MSlow |
|
|---|
| LysN MSlow |
|
|---|
| TryLysC MSlow |
|
|---|
| Try MShigh |
|
|---|
| ChTry MShigh |
|
|---|
| ArgC MShigh |
|
|---|
| LysN MShigh |
|
|---|
| TryLysC MShigh |
|
|---|
General Statistics
Number of major isoforms |
Number of additional isoforms |
Number of all proteins |
Number of amino acids |
Min. Seq. Length |
Max. Seq. Length |
Avg. Seq. Length |
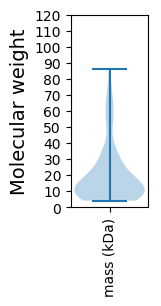
Avg. Mol. Weight |
|---|---|---|---|---|---|---|---|
0 |
16010 |
40 |
826 |
184.0 |
20.2 |
Amino acid frequency
Ala |
Cys |
Asp |
Glu |
Phe |
Gly |
His |
Ile |
Lys |
Leu |
|---|---|---|---|---|---|---|---|---|---|
9.731 ± 0.353 | 0.7 ± 0.107 |
6.621 ± 0.243 | 6.527 ± 0.312 |
3.186 ± 0.176 | 8.888 ± 0.65 |
2.061 ± 0.178 | 4.797 ± 0.206 |
4.191 ± 0.264 | 8.413 ± 0.227 |
Met |
Asn |
Gln |
Pro |
Arg |
Ser |
Thr |
Val |
Trp |
Tyr |
|---|---|---|---|---|---|---|---|---|---|
2.017 ± 0.132 | 3.21 ± 0.168 |
5.578 ± 0.197 | 3.317 ± 0.158 |
6.271 ± 0.42 | 5.99 ± 0.278 |
6.277 ± 0.236 | 7.283 ± 0.214 |
1.943 ± 0.095 | 2.998 ± 0.176 |
Most of the basic statistics you can see at this page can be downloaded from this CSV file
See this proteome in:

Proteome-pI is available under Creative Commons Attribution-NoDerivs license, for more details see here
| Reference: Kozlowski LP. Proteome-pI 2.0: Proteome Isoelectric Point Database Update. Nucleic Acids Res. 2021, doi: 10.1093/nar/gkab944 | Contact: Lukasz P. Kozlowski |