Alysiella crassa
Taxonomy: cellular organisms; Bacteria; Proteobacteria; Betaproteobacteria; Neisseriales; Neisseriaceae; Alysiella
Average proteome isoelectric point is 6.64
Get precalculated fractions of proteins
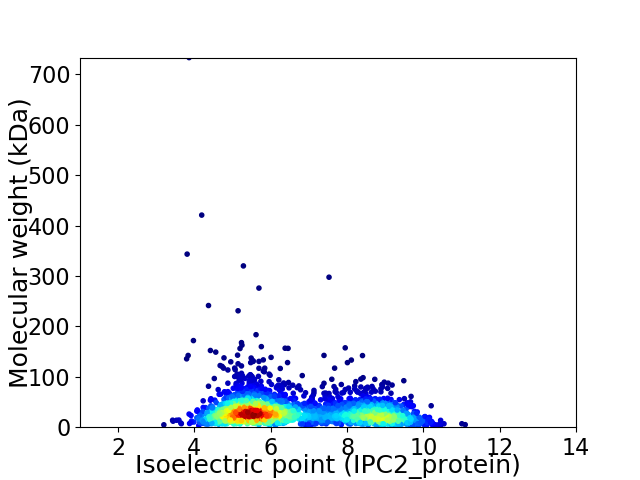
Virtual 2D-PAGE plot for 2612 proteins (isoelectric point calculated using IPC2_protein)
Get csv file with sequences according to given criteria:
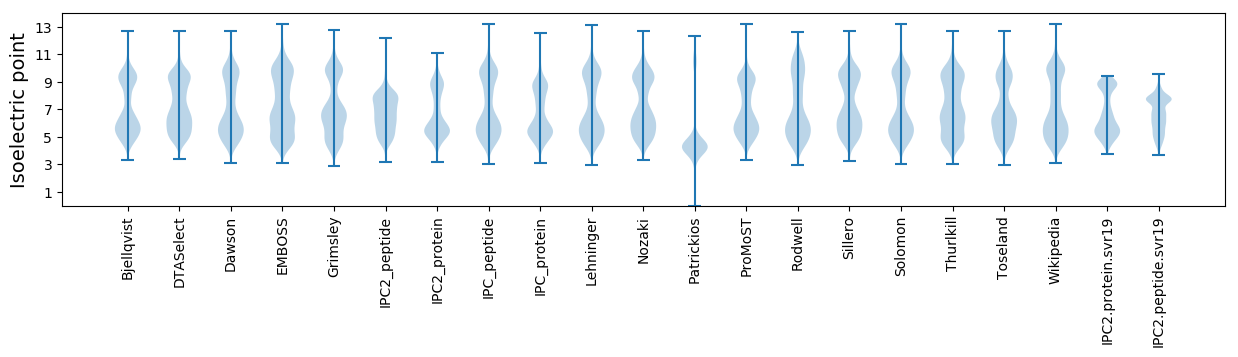
* You can choose from 21 different methods for calculating isoelectric point
Summary statistics related to proteome-wise predictions
Protein with the lowest isoelectric point:
>tr|A0A376BK83|A0A376BK83_9NEIS Superfamily II helicase and inactivated derivatives OS=Alysiella crassa OX=153491 GN=NCTC10283_00096 PE=4 SV=1
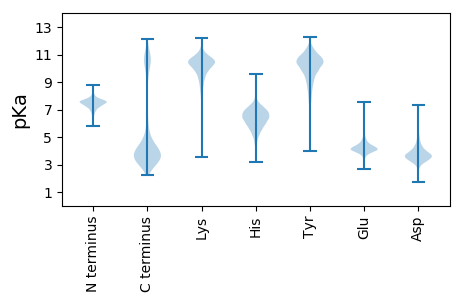
MM1 pKa = 6.68NTVVNPNHH9 pKa = 6.34DD10 pKa = 3.99TANIAYY16 pKa = 8.88LQGAISALEE25 pKa = 4.02SVEE28 pKa = 4.06TLMSNSDD35 pKa = 3.7EE36 pKa = 4.44NLTLDD41 pKa = 5.02DD42 pKa = 4.09VFQFIQDD49 pKa = 3.53FKK51 pKa = 10.55IGLMEE56 pKa = 4.24EE57 pKa = 4.87CEE59 pKa = 4.49CKK61 pKa = 10.39QGVQSS66 pKa = 3.9
MM1 pKa = 6.68NTVVNPNHH9 pKa = 6.34DD10 pKa = 3.99TANIAYY16 pKa = 8.88LQGAISALEE25 pKa = 4.02SVEE28 pKa = 4.06TLMSNSDD35 pKa = 3.7EE36 pKa = 4.44NLTLDD41 pKa = 5.02DD42 pKa = 4.09VFQFIQDD49 pKa = 3.53FKK51 pKa = 10.55IGLMEE56 pKa = 4.24EE57 pKa = 4.87CEE59 pKa = 4.49CKK61 pKa = 10.39QGVQSS66 pKa = 3.9
Molecular weight: 7.31 kDa
Isoelectric point according different methods:
Protein with the highest isoelectric point:
>tr|A0A376BT56|A0A376BT56_9NEIS Uncharacterized protein OS=Alysiella crassa OX=153491 GN=NCTC10283_01680 PE=4 SV=1
MM1 pKa = 7.34KK2 pKa = 10.13RR3 pKa = 11.84HH4 pKa = 5.49SVQLLALALSAAVASKK20 pKa = 9.97PVSIPTPKK28 pKa = 9.53FTQSVPLAHH37 pKa = 6.78AVIRR41 pKa = 11.84KK42 pKa = 8.39HH43 pKa = 5.23RR44 pKa = 11.84HH45 pKa = 4.75SGVAANRR52 pKa = 11.84RR53 pKa = 11.84MAKK56 pKa = 9.47KK57 pKa = 9.87RR58 pKa = 11.84KK59 pKa = 8.71KK60 pKa = 10.73AKK62 pKa = 8.87TT63 pKa = 3.37
MM1 pKa = 7.34KK2 pKa = 10.13RR3 pKa = 11.84HH4 pKa = 5.49SVQLLALALSAAVASKK20 pKa = 9.97PVSIPTPKK28 pKa = 9.53FTQSVPLAHH37 pKa = 6.78AVIRR41 pKa = 11.84KK42 pKa = 8.39HH43 pKa = 5.23RR44 pKa = 11.84HH45 pKa = 4.75SGVAANRR52 pKa = 11.84RR53 pKa = 11.84MAKK56 pKa = 9.47KK57 pKa = 9.87RR58 pKa = 11.84KK59 pKa = 8.71KK60 pKa = 10.73AKK62 pKa = 8.87TT63 pKa = 3.37
Molecular weight: 6.88 kDa
Isoelectric point according different methods:
Peptides (in silico digests for buttom-up proteomics)
Below you can find in silico digests of the whole proteome with Trypsin, Chymotrypsin, Trypsin+LysC, LysN, ArgC proteases suitable for different mass spec machines.| Try ESI |
 |
|---|
| ChTry ESI |
|
|---|
| ArgC ESI |
|
|---|
| LysN ESI |
|
|---|
| TryLysC ESI |
|
|---|
| Try MALDI |
|
|---|
| ChTry MALDI |
|
|---|
| ArgC MALDI |
|
|---|
| LysN MALDI |
|
|---|
| TryLysC MALDI |
|
|---|
| Try LTQ |
|
|---|
| ChTry LTQ |
|
|---|
| ArgC LTQ |
|
|---|
| LysN LTQ |
|
|---|
| TryLysC LTQ |
|
|---|
| Try MSlow |
|
|---|
| ChTry MSlow |
|
|---|
| ArgC MSlow |
|
|---|
| LysN MSlow |
|
|---|
| TryLysC MSlow |
|
|---|
| Try MShigh |
|
|---|
| ChTry MShigh |
|
|---|
| ArgC MShigh |
|
|---|
| LysN MShigh |
|
|---|
| TryLysC MShigh |
|
|---|
General Statistics
Number of major isoforms |
Number of additional isoforms |
Number of all proteins |
Number of amino acids |
Min. Seq. Length |
Max. Seq. Length |
Avg. Seq. Length |
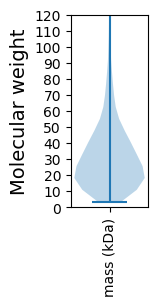
Avg. Mol. Weight |
|---|---|---|---|---|---|---|---|
0 |
795213 |
31 |
7019 |
304.4 |
33.84 |
Amino acid frequency
Ala |
Cys |
Asp |
Glu |
Phe |
Gly |
His |
Ile |
Lys |
Leu |
|---|---|---|---|---|---|---|---|---|---|
9.882 ± 0.093 | 0.983 ± 0.019 |
5.254 ± 0.049 | 5.823 ± 0.049 |
4.153 ± 0.047 | 6.679 ± 0.057 |
2.449 ± 0.03 | 5.989 ± 0.039 |
5.527 ± 0.049 | 10.018 ± 0.082 |
Met |
Asn |
Gln |
Pro |
Arg |
Ser |
Thr |
Val |
Trp |
Tyr |
|---|---|---|---|---|---|---|---|---|---|
2.566 ± 0.034 | 4.807 ± 0.06 |
4.113 ± 0.054 | 5.102 ± 0.061 |
4.617 ± 0.057 | 5.442 ± 0.043 |
5.462 ± 0.105 | 6.767 ± 0.054 |
1.364 ± 0.025 | 3.002 ± 0.029 |
Most of the basic statistics you can see at this page can be downloaded from this CSV file
See this proteome in:

Proteome-pI is available under Creative Commons Attribution-NoDerivs license, for more details see here
| Reference: Kozlowski LP. Proteome-pI 2.0: Proteome Isoelectric Point Database Update. Nucleic Acids Res. 2021, doi: 10.1093/nar/gkab944 | Contact: Lukasz P. Kozlowski |