Streptomyces cacaoi subsp. cacaoi
Taxonomy: cellular organisms; Bacteria; Terrabacteria group; Actinobacteria; Actinomycetia; Streptomycetales; Streptomycetaceae; Streptomyces; Streptomyces cacaoi
Average proteome isoelectric point is 6.53
Get precalculated fractions of proteins
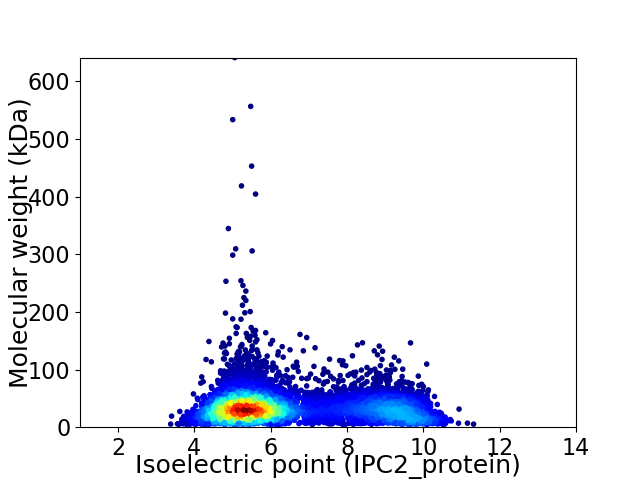
Virtual 2D-PAGE plot for 6946 proteins (isoelectric point calculated using IPC2_protein)
Get csv file with sequences according to given criteria:
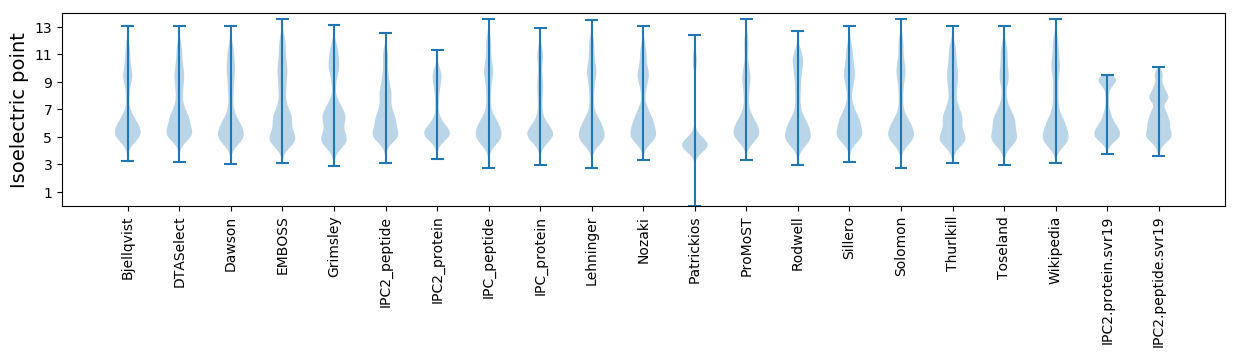
* You can choose from 21 different methods for calculating isoelectric point
Summary statistics related to proteome-wise predictions
Protein with the lowest isoelectric point:
>tr|A0A4Y3R0A0|A0A4Y3R0A0_STRCI Uncharacterized protein OS=Streptomyces cacaoi subsp. cacaoi OX=66857 GN=SCA03_35120 PE=4 SV=1
MM1 pKa = 7.34AASAEE6 pKa = 4.13LLMSALAPLPQQRR19 pKa = 11.84ALSKK23 pKa = 10.46QGHH26 pKa = 5.61EE27 pKa = 4.29PADD30 pKa = 3.91LSAVSAPDD38 pKa = 3.21SGLDD42 pKa = 3.62GSCICGCADD51 pKa = 3.51TPLTSEE57 pKa = 4.74PPLIDD62 pKa = 4.1LAPLTSEE69 pKa = 4.6PPLAEE74 pKa = 4.55APLTSEE80 pKa = 3.96PAGVPFGTDD89 pKa = 2.97PAAII93 pKa = 4.15
MM1 pKa = 7.34AASAEE6 pKa = 4.13LLMSALAPLPQQRR19 pKa = 11.84ALSKK23 pKa = 10.46QGHH26 pKa = 5.61EE27 pKa = 4.29PADD30 pKa = 3.91LSAVSAPDD38 pKa = 3.21SGLDD42 pKa = 3.62GSCICGCADD51 pKa = 3.51TPLTSEE57 pKa = 4.74PPLIDD62 pKa = 4.1LAPLTSEE69 pKa = 4.6PPLAEE74 pKa = 4.55APLTSEE80 pKa = 3.96PAGVPFGTDD89 pKa = 2.97PAAII93 pKa = 4.15
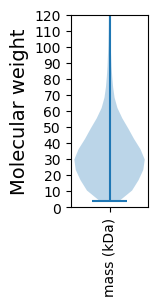
Molecular weight: 9.23 kDa
Isoelectric point according different methods:
Protein with the highest isoelectric point:
>tr|A0A4Y3R4B8|A0A4Y3R4B8_STRCI Phosphopantetheine adenylyltransferase OS=Streptomyces cacaoi subsp. cacaoi OX=66857 GN=coaD PE=3 SV=1
MM1 pKa = 7.69SKK3 pKa = 9.0RR4 pKa = 11.84TFQPNNRR11 pKa = 11.84RR12 pKa = 11.84RR13 pKa = 11.84AKK15 pKa = 8.7THH17 pKa = 5.15GFRR20 pKa = 11.84LRR22 pKa = 11.84MRR24 pKa = 11.84TRR26 pKa = 11.84AGRR29 pKa = 11.84AIVANRR35 pKa = 11.84RR36 pKa = 11.84SKK38 pKa = 10.81GRR40 pKa = 11.84ARR42 pKa = 11.84LSAA45 pKa = 3.91
MM1 pKa = 7.69SKK3 pKa = 9.0RR4 pKa = 11.84TFQPNNRR11 pKa = 11.84RR12 pKa = 11.84RR13 pKa = 11.84AKK15 pKa = 8.7THH17 pKa = 5.15GFRR20 pKa = 11.84LRR22 pKa = 11.84MRR24 pKa = 11.84TRR26 pKa = 11.84AGRR29 pKa = 11.84AIVANRR35 pKa = 11.84RR36 pKa = 11.84SKK38 pKa = 10.81GRR40 pKa = 11.84ARR42 pKa = 11.84LSAA45 pKa = 3.91
Molecular weight: 5.3 kDa
Isoelectric point according different methods:
Peptides (in silico digests for buttom-up proteomics)
Below you can find in silico digests of the whole proteome with Trypsin, Chymotrypsin, Trypsin+LysC, LysN, ArgC proteases suitable for different mass spec machines.| Try ESI |
 |
|---|
| ChTry ESI |
|
|---|
| ArgC ESI |
|
|---|
| LysN ESI |
|
|---|
| TryLysC ESI |
|
|---|
| Try MALDI |
|
|---|
| ChTry MALDI |
|
|---|
| ArgC MALDI |
|
|---|
| LysN MALDI |
|
|---|
| TryLysC MALDI |
|
|---|
| Try LTQ |
|
|---|
| ChTry LTQ |
|
|---|
| ArgC LTQ |
|
|---|
| LysN LTQ |
|
|---|
| TryLysC LTQ |
|
|---|
| Try MSlow |
|
|---|
| ChTry MSlow |
|
|---|
| ArgC MSlow |
|
|---|
| LysN MSlow |
|
|---|
| TryLysC MSlow |
|
|---|
| Try MShigh |
|
|---|
| ChTry MShigh |
|
|---|
| ArgC MShigh |
|
|---|
| LysN MShigh |
|
|---|
| TryLysC MShigh |
|
|---|
General Statistics
Number of major isoforms |
Number of additional isoforms |
Number of all proteins |
Number of amino acids |
Min. Seq. Length |
Max. Seq. Length |
Avg. Seq. Length |
Avg. Mol. Weight |
|---|---|---|---|---|---|---|---|
0 |
2355190 |
39 |
6135 |
339.1 |
36.09 |
Amino acid frequency
Ala |
Cys |
Asp |
Glu |
Phe |
Gly |
His |
Ile |
Lys |
Leu |
|---|---|---|---|---|---|---|---|---|---|
14.13 ± 0.047 | 0.833 ± 0.008 |
5.825 ± 0.022 | 5.978 ± 0.029 |
2.577 ± 0.017 | 10.264 ± 0.033 |
2.446 ± 0.013 | 2.562 ± 0.019 |
1.835 ± 0.025 | 10.233 ± 0.037 |
Met |
Asn |
Gln |
Pro |
Arg |
Ser |
Thr |
Val |
Trp |
Tyr |
|---|---|---|---|---|---|---|---|---|---|
1.634 ± 0.012 | 1.491 ± 0.013 |
6.702 ± 0.031 | 2.612 ± 0.018 |
8.708 ± 0.033 | 4.887 ± 0.021 |
5.88 ± 0.022 | 8.123 ± 0.024 |
1.419 ± 0.012 | 1.861 ± 0.013 |
Most of the basic statistics you can see at this page can be downloaded from this CSV file
See this proteome in:

Proteome-pI is available under Creative Commons Attribution-NoDerivs license, for more details see here
| Reference: Kozlowski LP. Proteome-pI 2.0: Proteome Isoelectric Point Database Update. Nucleic Acids Res. 2021, doi: 10.1093/nar/gkab944 | Contact: Lukasz P. Kozlowski |