Xanthomonas phage XcP1
Taxonomy: Viruses; Duplodnaviria; Heunggongvirae; Uroviricota; Caudoviricetes; Caudovirales; Myoviridae; Carpasinavirus; Xanthomonas virus XcP1
Average proteome isoelectric point is 6.3
Get precalculated fractions of proteins
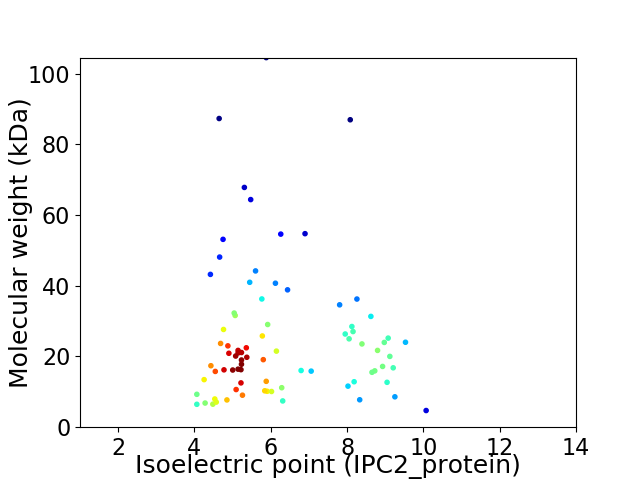
Virtual 2D-PAGE plot for 81 proteins (isoelectric point calculated using IPC2_protein)
Get csv file with sequences according to given criteria:
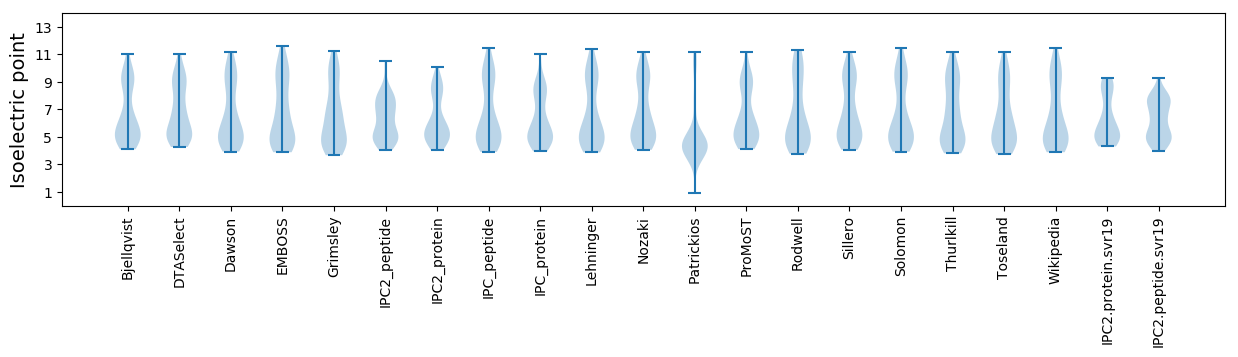
* You can choose from 21 different methods for calculating isoelectric point
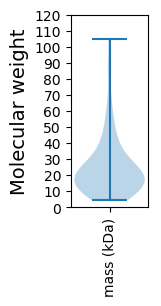
Summary statistics related to proteome-wise predictions
Protein with the lowest isoelectric point:
>tr|A0A3S7L8S9|A0A3S7L8S9_9CAUD Minor head protein OS=Xanthomonas phage XcP1 OX=2785027 GN=XcP1_006 PE=4 SV=1
MM1 pKa = 7.6IVEE4 pKa = 4.31FAFDD8 pKa = 3.52NGHH11 pKa = 5.59TEE13 pKa = 3.85QYY15 pKa = 8.63TVKK18 pKa = 9.12TLEE21 pKa = 4.06EE22 pKa = 4.65AYY24 pKa = 9.9SHH26 pKa = 7.51CIATWNKK33 pKa = 9.84SCSSDD38 pKa = 3.3DD39 pKa = 3.42MAEE42 pKa = 3.91FRR44 pKa = 11.84VGCAEE49 pKa = 4.17DD50 pKa = 4.01LNNAGVCHH58 pKa = 7.2RR59 pKa = 11.84IILDD63 pKa = 3.37
MM1 pKa = 7.6IVEE4 pKa = 4.31FAFDD8 pKa = 3.52NGHH11 pKa = 5.59TEE13 pKa = 3.85QYY15 pKa = 8.63TVKK18 pKa = 9.12TLEE21 pKa = 4.06EE22 pKa = 4.65AYY24 pKa = 9.9SHH26 pKa = 7.51CIATWNKK33 pKa = 9.84SCSSDD38 pKa = 3.3DD39 pKa = 3.42MAEE42 pKa = 3.91FRR44 pKa = 11.84VGCAEE49 pKa = 4.17DD50 pKa = 4.01LNNAGVCHH58 pKa = 7.2RR59 pKa = 11.84IILDD63 pKa = 3.37
Molecular weight: 7.1 kDa
Isoelectric point according different methods:
Protein with the highest isoelectric point:
>tr|A0A3S7L8M1|A0A3S7L8M1_9CAUD DNA helicase OS=Xanthomonas phage XcP1 OX=2785027 GN=XcP1_052 PE=4 SV=1
MM1 pKa = 7.66GIKK4 pKa = 9.99KK5 pKa = 10.35RR6 pKa = 11.84IRR8 pKa = 11.84SSAHH12 pKa = 5.43LVCLVIVIVLAVSAGIMYY30 pKa = 10.21GSSFAPRR37 pKa = 11.84QPGASGSWW45 pKa = 3.08
MM1 pKa = 7.66GIKK4 pKa = 9.99KK5 pKa = 10.35RR6 pKa = 11.84IRR8 pKa = 11.84SSAHH12 pKa = 5.43LVCLVIVIVLAVSAGIMYY30 pKa = 10.21GSSFAPRR37 pKa = 11.84QPGASGSWW45 pKa = 3.08
Molecular weight: 4.72 kDa
Isoelectric point according different methods:
Peptides (in silico digests for buttom-up proteomics)
Below you can find in silico digests of the whole proteome with Trypsin, Chymotrypsin, Trypsin+LysC, LysN, ArgC proteases suitable for different mass spec machines.| Try ESI |
 |
|---|
| ChTry ESI |
|
|---|
| ArgC ESI |
|
|---|
| LysN ESI |
|
|---|
| TryLysC ESI |
|
|---|
| Try MALDI |
|
|---|
| ChTry MALDI |
|
|---|
| ArgC MALDI |
|
|---|
| LysN MALDI |
|
|---|
| TryLysC MALDI |
|
|---|
| Try LTQ |
|
|---|
| ChTry LTQ |
|
|---|
| ArgC LTQ |
|
|---|
| LysN LTQ |
|
|---|
| TryLysC LTQ |
|
|---|
| Try MSlow |
|
|---|
| ChTry MSlow |
|
|---|
| ArgC MSlow |
|
|---|
| LysN MSlow |
|
|---|
| TryLysC MSlow |
|
|---|
| Try MShigh |
|
|---|
| ChTry MShigh |
|
|---|
| ArgC MShigh |
|
|---|
| LysN MShigh |
|
|---|
| TryLysC MShigh |
|
|---|
General Statistics
Number of major isoforms |
Number of additional isoforms |
Number of all proteins |
Number of amino acids |
Min. Seq. Length |
Max. Seq. Length |
Avg. Seq. Length |
Avg. Mol. Weight |
|---|---|---|---|---|---|---|---|
0 |
18642 |
45 |
942 |
230.1 |
25.24 |
Amino acid frequency
Ala |
Cys |
Asp |
Glu |
Phe |
Gly |
His |
Ile |
Lys |
Leu |
|---|---|---|---|---|---|---|---|---|---|
10.31 ± 0.328 | 0.987 ± 0.116 |
5.917 ± 0.244 | 6.346 ± 0.334 |
3.911 ± 0.171 | 7.655 ± 0.349 |
1.641 ± 0.155 | 6.019 ± 0.219 |
5.933 ± 0.327 | 7.311 ± 0.215 |
Met |
Asn |
Gln |
Pro |
Arg |
Ser |
Thr |
Val |
Trp |
Tyr |
|---|---|---|---|---|---|---|---|---|---|
2.661 ± 0.123 | 4.377 ± 0.232 |
4.259 ± 0.175 | 3.921 ± 0.163 |
5.348 ± 0.233 | 7.172 ± 0.33 |
5.402 ± 0.233 | 7.022 ± 0.209 |
1.245 ± 0.091 | 2.564 ± 0.135 |
Most of the basic statistics you can see at this page can be downloaded from this CSV file
See this proteome in:

Proteome-pI is available under Creative Commons Attribution-NoDerivs license, for more details see here
| Reference: Kozlowski LP. Proteome-pI 2.0: Proteome Isoelectric Point Database Update. Nucleic Acids Res. 2021, doi: 10.1093/nar/gkab944 | Contact: Lukasz P. Kozlowski |