Corticimicrobacter populi
Taxonomy: cellular organisms; Bacteria; Proteobacteria; Betaproteobacteria; Burkholderiales; Alcaligenaceae; Corticimicrobacter
Average proteome isoelectric point is 6.44
Get precalculated fractions of proteins
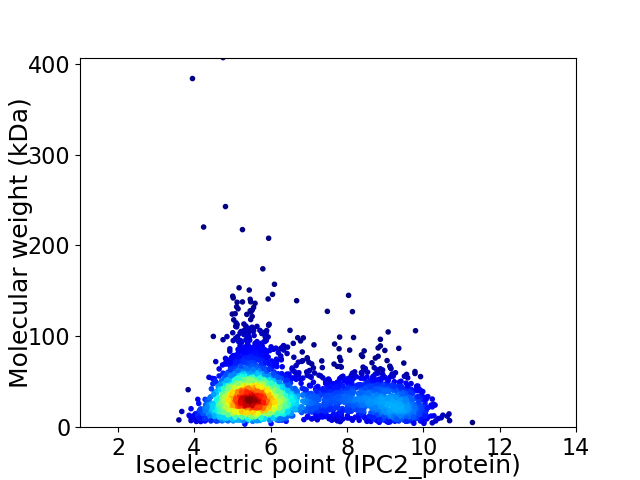
Virtual 2D-PAGE plot for 3237 proteins (isoelectric point calculated using IPC2_protein)
Get csv file with sequences according to given criteria:
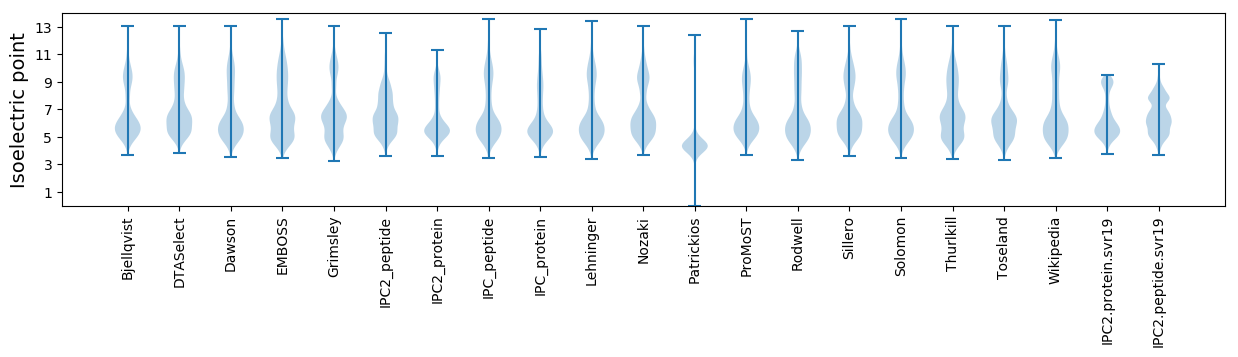
* You can choose from 21 different methods for calculating isoelectric point
Summary statistics related to proteome-wise predictions
Protein with the lowest isoelectric point:
>tr|A0A2V1JXE6|A0A2V1JXE6_9BURK Metal ABC transporter substrate-binding protein OS=Corticimicrobacter populi OX=2175229 GN=DD235_13970 PE=3 SV=1
MM1 pKa = 7.13WCVPRR6 pKa = 11.84YY7 pKa = 9.23LVQSTEE13 pKa = 4.2DD14 pKa = 3.7GSFLAADD21 pKa = 4.07GEE23 pKa = 4.72GGVINVMALTAADD36 pKa = 4.06PFQEE40 pKa = 4.34PEE42 pKa = 4.13SAVEE46 pKa = 3.9AVQDD50 pKa = 3.78HH51 pKa = 6.77LDD53 pKa = 3.45GRR55 pKa = 11.84GVVILIYY62 pKa = 10.19VPCIQAA68 pKa = 3.48
MM1 pKa = 7.13WCVPRR6 pKa = 11.84YY7 pKa = 9.23LVQSTEE13 pKa = 4.2DD14 pKa = 3.7GSFLAADD21 pKa = 4.07GEE23 pKa = 4.72GGVINVMALTAADD36 pKa = 4.06PFQEE40 pKa = 4.34PEE42 pKa = 4.13SAVEE46 pKa = 3.9AVQDD50 pKa = 3.78HH51 pKa = 6.77LDD53 pKa = 3.45GRR55 pKa = 11.84GVVILIYY62 pKa = 10.19VPCIQAA68 pKa = 3.48
Molecular weight: 7.26 kDa
Isoelectric point according different methods:
Protein with the highest isoelectric point:
>tr|A0A2V1JYB7|A0A2V1JYB7_9BURK Flg_hook domain-containing protein OS=Corticimicrobacter populi OX=2175229 GN=DD235_15245 PE=4 SV=1
MM1 pKa = 7.45KK2 pKa = 9.51RR3 pKa = 11.84TFQPSVTRR11 pKa = 11.84RR12 pKa = 11.84KK13 pKa = 8.0RR14 pKa = 11.84THH16 pKa = 5.76GFRR19 pKa = 11.84VRR21 pKa = 11.84MKK23 pKa = 8.99TRR25 pKa = 11.84AGRR28 pKa = 11.84AVLSARR34 pKa = 11.84RR35 pKa = 11.84AKK37 pKa = 9.92GRR39 pKa = 11.84KK40 pKa = 8.75RR41 pKa = 11.84LAVV44 pKa = 3.41
MM1 pKa = 7.45KK2 pKa = 9.51RR3 pKa = 11.84TFQPSVTRR11 pKa = 11.84RR12 pKa = 11.84KK13 pKa = 8.0RR14 pKa = 11.84THH16 pKa = 5.76GFRR19 pKa = 11.84VRR21 pKa = 11.84MKK23 pKa = 8.99TRR25 pKa = 11.84AGRR28 pKa = 11.84AVLSARR34 pKa = 11.84RR35 pKa = 11.84AKK37 pKa = 9.92GRR39 pKa = 11.84KK40 pKa = 8.75RR41 pKa = 11.84LAVV44 pKa = 3.41
Molecular weight: 5.18 kDa
Isoelectric point according different methods:
Peptides (in silico digests for buttom-up proteomics)
Below you can find in silico digests of the whole proteome with Trypsin, Chymotrypsin, Trypsin+LysC, LysN, ArgC proteases suitable for different mass spec machines.| Try ESI |
 |
|---|
| ChTry ESI |
|
|---|
| ArgC ESI |
|
|---|
| LysN ESI |
|
|---|
| TryLysC ESI |
|
|---|
| Try MALDI |
|
|---|
| ChTry MALDI |
|
|---|
| ArgC MALDI |
|
|---|
| LysN MALDI |
|
|---|
| TryLysC MALDI |
|
|---|
| Try LTQ |
|
|---|
| ChTry LTQ |
|
|---|
| ArgC LTQ |
|
|---|
| LysN LTQ |
|
|---|
| TryLysC LTQ |
|
|---|
| Try MSlow |
|
|---|
| ChTry MSlow |
|
|---|
| ArgC MSlow |
|
|---|
| LysN MSlow |
|
|---|
| TryLysC MSlow |
|
|---|
| Try MShigh |
|
|---|
| ChTry MShigh |
|
|---|
| ArgC MShigh |
|
|---|
| LysN MShigh |
|
|---|
| TryLysC MShigh |
|
|---|
General Statistics
Number of major isoforms |
Number of additional isoforms |
Number of all proteins |
Number of amino acids |
Min. Seq. Length |
Max. Seq. Length |
Avg. Seq. Length |
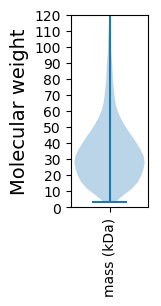
Avg. Mol. Weight |
|---|---|---|---|---|---|---|---|
0 |
1076608 |
34 |
3991 |
332.6 |
36.34 |
Amino acid frequency
Ala |
Cys |
Asp |
Glu |
Phe |
Gly |
His |
Ile |
Lys |
Leu |
|---|---|---|---|---|---|---|---|---|---|
11.944 ± 0.054 | 0.923 ± 0.014 |
5.524 ± 0.039 | 5.268 ± 0.042 |
3.38 ± 0.027 | 8.073 ± 0.046 |
2.354 ± 0.024 | 4.943 ± 0.036 |
2.563 ± 0.032 | 11.231 ± 0.057 |
Met |
Asn |
Gln |
Pro |
Arg |
Ser |
Thr |
Val |
Trp |
Tyr |
|---|---|---|---|---|---|---|---|---|---|
2.474 ± 0.024 | 2.636 ± 0.03 |
5.025 ± 0.036 | 4.611 ± 0.038 |
7.129 ± 0.042 | 5.579 ± 0.031 |
5.217 ± 0.03 | 7.19 ± 0.037 |
1.522 ± 0.021 | 2.416 ± 0.021 |
Most of the basic statistics you can see at this page can be downloaded from this CSV file
See this proteome in:

Proteome-pI is available under Creative Commons Attribution-NoDerivs license, for more details see here
| Reference: Kozlowski LP. Proteome-pI 2.0: Proteome Isoelectric Point Database Update. Nucleic Acids Res. 2021, doi: 10.1093/nar/gkab944 | Contact: Lukasz P. Kozlowski |