Rhodopirellula pilleata
Taxonomy: cellular organisms; Bacteria; PVC group; Planctomycetes; Planctomycetia; Pirellulales; Pirellulaceae;
Average proteome isoelectric point is 6.1
Get precalculated fractions of proteins
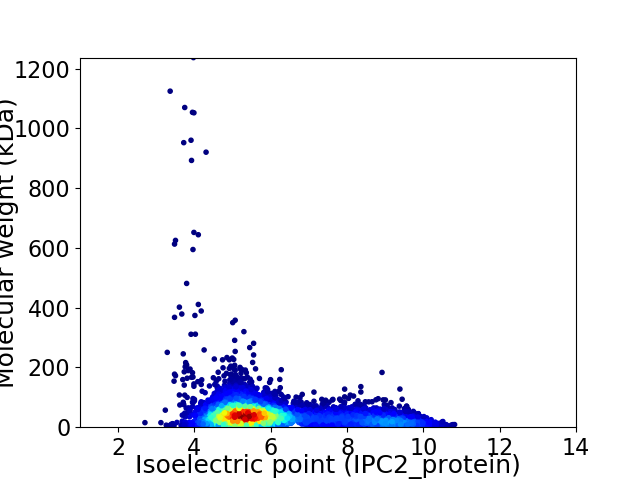
Virtual 2D-PAGE plot for 6138 proteins (isoelectric point calculated using IPC2_protein)
Get csv file with sequences according to given criteria:
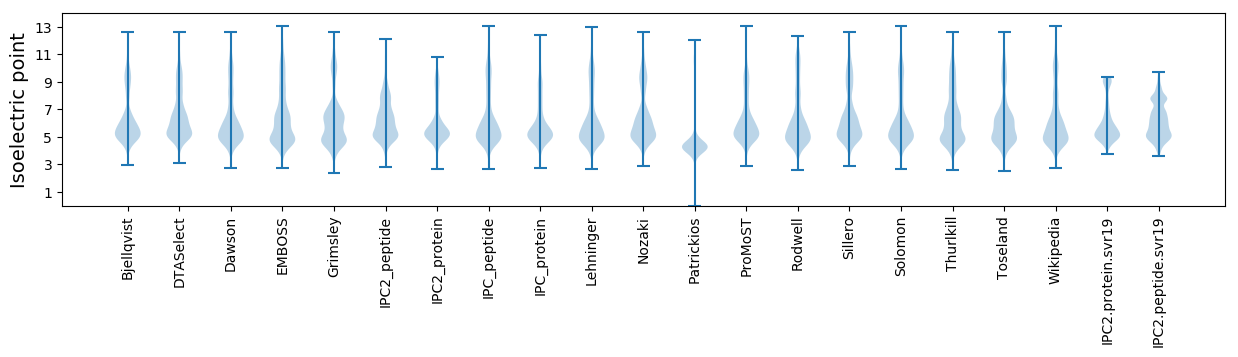
* You can choose from 21 different methods for calculating isoelectric point
Summary statistics related to proteome-wise predictions
Protein with the lowest isoelectric point:
>tr|A0A5C6AVL8|A0A5C6AVL8_9BACT Uncharacterized protein OS=Rhodopirellula pilleata OX=2714738 GN=Pla100_04540 PE=4 SV=1
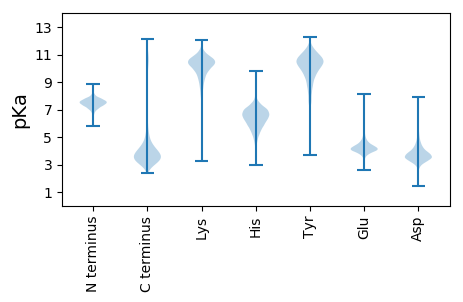
MM1 pKa = 7.85LITRR5 pKa = 11.84VDD7 pKa = 3.67DD8 pKa = 3.75VDD10 pKa = 4.34FCGKK14 pKa = 8.24TVLSGGFSCDD24 pKa = 3.35FAGCAAGEE32 pKa = 4.16ACVCVIISWPLWPDD46 pKa = 3.61PVQSDD51 pKa = 4.3GLPDD55 pKa = 3.53PHH57 pKa = 8.27SDD59 pKa = 4.05LDD61 pKa = 4.1RR62 pKa = 11.84NN63 pKa = 3.81
MM1 pKa = 7.85LITRR5 pKa = 11.84VDD7 pKa = 3.67DD8 pKa = 3.75VDD10 pKa = 4.34FCGKK14 pKa = 8.24TVLSGGFSCDD24 pKa = 3.35FAGCAAGEE32 pKa = 4.16ACVCVIISWPLWPDD46 pKa = 3.61PVQSDD51 pKa = 4.3GLPDD55 pKa = 3.53PHH57 pKa = 8.27SDD59 pKa = 4.05LDD61 pKa = 4.1RR62 pKa = 11.84NN63 pKa = 3.81
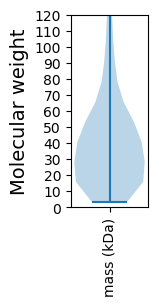
Molecular weight: 6.71 kDa
Isoelectric point according different methods:
Protein with the highest isoelectric point:
>tr|A0A5C5ZVM4|A0A5C5ZVM4_9BACT Uncharacterized protein OS=Rhodopirellula pilleata OX=2714738 GN=Pla100_52170 PE=4 SV=1
MM1 pKa = 7.25FWLIGWIVFGFVVGLIARR19 pKa = 11.84ALMPGTQPLGFFRR32 pKa = 11.84TMLLGVAGSFIGGLIGFFIVGGSLIQSSGWIGSIIGAVILLALQIRR78 pKa = 11.84RR79 pKa = 11.84GRR81 pKa = 11.84IAAA84 pKa = 3.95
MM1 pKa = 7.25FWLIGWIVFGFVVGLIARR19 pKa = 11.84ALMPGTQPLGFFRR32 pKa = 11.84TMLLGVAGSFIGGLIGFFIVGGSLIQSSGWIGSIIGAVILLALQIRR78 pKa = 11.84RR79 pKa = 11.84GRR81 pKa = 11.84IAAA84 pKa = 3.95
Molecular weight: 8.87 kDa
Isoelectric point according different methods:
Peptides (in silico digests for buttom-up proteomics)
Below you can find in silico digests of the whole proteome with Trypsin, Chymotrypsin, Trypsin+LysC, LysN, ArgC proteases suitable for different mass spec machines.| Try ESI |
 |
|---|
| ChTry ESI |
|
|---|
| ArgC ESI |
|
|---|
| LysN ESI |
|
|---|
| TryLysC ESI |
|
|---|
| Try MALDI |
|
|---|
| ChTry MALDI |
|
|---|
| ArgC MALDI |
|
|---|
| LysN MALDI |
|
|---|
| TryLysC MALDI |
|
|---|
| Try LTQ |
|
|---|
| ChTry LTQ |
|
|---|
| ArgC LTQ |
|
|---|
| LysN LTQ |
|
|---|
| TryLysC LTQ |
|
|---|
| Try MSlow |
|
|---|
| ChTry MSlow |
|
|---|
| ArgC MSlow |
|
|---|
| LysN MSlow |
|
|---|
| TryLysC MSlow |
|
|---|
| Try MShigh |
|
|---|
| ChTry MShigh |
|
|---|
| ArgC MShigh |
|
|---|
| LysN MShigh |
|
|---|
| TryLysC MShigh |
|
|---|
General Statistics
Number of major isoforms |
Number of additional isoforms |
Number of all proteins |
Number of amino acids |
Min. Seq. Length |
Max. Seq. Length |
Avg. Seq. Length |
Avg. Mol. Weight |
|---|---|---|---|---|---|---|---|
0 |
2488680 |
30 |
11740 |
405.5 |
44.54 |
Amino acid frequency
Ala |
Cys |
Asp |
Glu |
Phe |
Gly |
His |
Ile |
Lys |
Leu |
|---|---|---|---|---|---|---|---|---|---|
9.423 ± 0.035 | 1.058 ± 0.018 |
6.558 ± 0.043 | 5.924 ± 0.037 |
3.692 ± 0.02 | 7.768 ± 0.061 |
2.18 ± 0.023 | 5.358 ± 0.025 |
3.234 ± 0.039 | 9.364 ± 0.037 |
Met |
Asn |
Gln |
Pro |
Arg |
Ser |
Thr |
Val |
Trp |
Tyr |
|---|---|---|---|---|---|---|---|---|---|
2.249 ± 0.025 | 3.424 ± 0.043 |
5.207 ± 0.036 | 4.002 ± 0.025 |
6.671 ± 0.052 | 6.969 ± 0.035 |
5.987 ± 0.063 | 7.185 ± 0.029 |
1.471 ± 0.019 | 2.277 ± 0.018 |
Most of the basic statistics you can see at this page can be downloaded from this CSV file
See this proteome in:

Proteome-pI is available under Creative Commons Attribution-NoDerivs license, for more details see here
| Reference: Kozlowski LP. Proteome-pI 2.0: Proteome Isoelectric Point Database Update. Nucleic Acids Res. 2021, doi: 10.1093/nar/gkab944 | Contact: Lukasz P. Kozlowski |