Mycobacterium phage B1
Taxonomy: Viruses; Duplodnaviria; Heunggongvirae; Uroviricota; Caudoviricetes; Caudovirales; Siphoviridae; Fromanvirus; unclassified Fromanvirus
Average proteome isoelectric point is 6.18
Get precalculated fractions of proteins
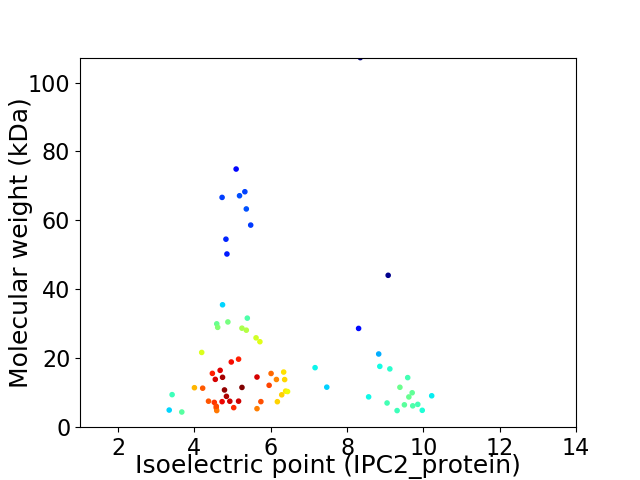
Virtual 2D-PAGE plot for 73 proteins (isoelectric point calculated using IPC2_protein)
Get csv file with sequences according to given criteria:
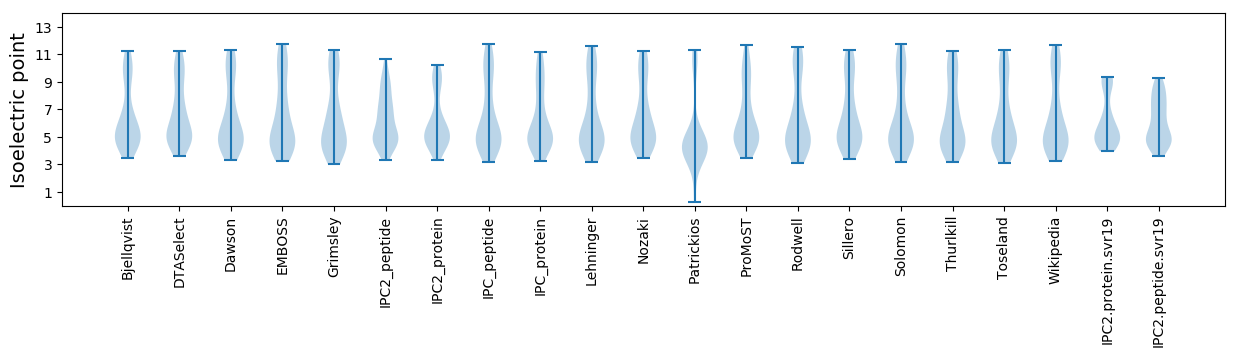
* You can choose from 21 different methods for calculating isoelectric point
Summary statistics related to proteome-wise predictions
Protein with the lowest isoelectric point:
>tr|A0A2Z5XV90|A0A2Z5XV90_9CAUD Putative esterase/lipase OS=Mycobacterium phage B1 OX=2077133 PE=4 SV=1
MM1 pKa = 7.52MLTQEE6 pKa = 4.41DD7 pKa = 4.94FEE9 pKa = 6.42AEE11 pKa = 4.22LVQDD15 pKa = 4.12SYY17 pKa = 11.9YY18 pKa = 11.25DD19 pKa = 3.48GMNMFEE25 pKa = 4.27QAAQAGLEE33 pKa = 3.96GRR35 pKa = 11.84NYY37 pKa = 10.83LL38 pKa = 4.3
MM1 pKa = 7.52MLTQEE6 pKa = 4.41DD7 pKa = 4.94FEE9 pKa = 6.42AEE11 pKa = 4.22LVQDD15 pKa = 4.12SYY17 pKa = 11.9YY18 pKa = 11.25DD19 pKa = 3.48GMNMFEE25 pKa = 4.27QAAQAGLEE33 pKa = 3.96GRR35 pKa = 11.84NYY37 pKa = 10.83LL38 pKa = 4.3
Molecular weight: 4.41 kDa
Isoelectric point according different methods:
Protein with the highest isoelectric point:
>tr|A0A2Z5XV84|A0A2Z5XV84_9CAUD Uncharacterized protein OS=Mycobacterium phage B1 OX=2077133 PE=4 SV=1
MM1 pKa = 6.94IVARR5 pKa = 11.84RR6 pKa = 11.84RR7 pKa = 11.84VALGVASAGTVAVGGLAFALSFTALRR33 pKa = 11.84DD34 pKa = 3.56LSASNGVAQAWMVPLVVDD52 pKa = 3.79GGIIVATAATVALRR66 pKa = 11.84RR67 pKa = 11.84HH68 pKa = 5.22QWYY71 pKa = 9.42AWTLLILSSLVSVAGNVAHH90 pKa = 6.57AQAHH94 pKa = 5.49GAIAMVIAAIPPLWLLAATHH114 pKa = 5.73LTVMLSRR121 pKa = 11.84SDD123 pKa = 3.85KK124 pKa = 10.87EE125 pKa = 4.24PVPVAAEE132 pKa = 3.9PLHH135 pKa = 6.32IANAAA140 pKa = 3.29
MM1 pKa = 6.94IVARR5 pKa = 11.84RR6 pKa = 11.84RR7 pKa = 11.84VALGVASAGTVAVGGLAFALSFTALRR33 pKa = 11.84DD34 pKa = 3.56LSASNGVAQAWMVPLVVDD52 pKa = 3.79GGIIVATAATVALRR66 pKa = 11.84RR67 pKa = 11.84HH68 pKa = 5.22QWYY71 pKa = 9.42AWTLLILSSLVSVAGNVAHH90 pKa = 6.57AQAHH94 pKa = 5.49GAIAMVIAAIPPLWLLAATHH114 pKa = 5.73LTVMLSRR121 pKa = 11.84SDD123 pKa = 3.85KK124 pKa = 10.87EE125 pKa = 4.24PVPVAAEE132 pKa = 3.9PLHH135 pKa = 6.32IANAAA140 pKa = 3.29
Molecular weight: 14.39 kDa
Isoelectric point according different methods:
Peptides (in silico digests for buttom-up proteomics)
Below you can find in silico digests of the whole proteome with Trypsin, Chymotrypsin, Trypsin+LysC, LysN, ArgC proteases suitable for different mass spec machines.| Try ESI |
 |
|---|
| ChTry ESI |
|
|---|
| ArgC ESI |
|
|---|
| LysN ESI |
|
|---|
| TryLysC ESI |
|
|---|
| Try MALDI |
|
|---|
| ChTry MALDI |
|
|---|
| ArgC MALDI |
|
|---|
| LysN MALDI |
|
|---|
| TryLysC MALDI |
|
|---|
| Try LTQ |
|
|---|
| ChTry LTQ |
|
|---|
| ArgC LTQ |
|
|---|
| LysN LTQ |
|
|---|
| TryLysC LTQ |
|
|---|
| Try MSlow |
|
|---|
| ChTry MSlow |
|
|---|
| ArgC MSlow |
|
|---|
| LysN MSlow |
|
|---|
| TryLysC MSlow |
|
|---|
| Try MShigh |
|
|---|
| ChTry MShigh |
|
|---|
| ArgC MShigh |
|
|---|
| LysN MShigh |
|
|---|
| TryLysC MShigh |
|
|---|
General Statistics
Number of major isoforms |
Number of additional isoforms |
Number of all proteins |
Number of amino acids |
Min. Seq. Length |
Max. Seq. Length |
Avg. Seq. Length |
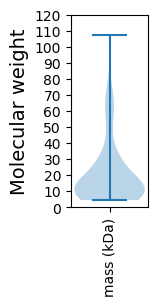
Avg. Mol. Weight |
|---|---|---|---|---|---|---|---|
0 |
13722 |
38 |
1014 |
188.0 |
20.84 |
Amino acid frequency
Ala |
Cys |
Asp |
Glu |
Phe |
Gly |
His |
Ile |
Lys |
Leu |
|---|---|---|---|---|---|---|---|---|---|
9.678 ± 0.406 | 0.743 ± 0.11 |
6.391 ± 0.239 | 6.843 ± 0.376 |
3.345 ± 0.212 | 8.177 ± 0.53 |
2.092 ± 0.202 | 4.722 ± 0.158 |
4.307 ± 0.204 | 8.279 ± 0.291 |
Met |
Asn |
Gln |
Pro |
Arg |
Ser |
Thr |
Val |
Trp |
Tyr |
|---|---|---|---|---|---|---|---|---|---|
2.463 ± 0.127 | 3.571 ± 0.227 |
5.764 ± 0.396 | 3.848 ± 0.342 |
6.69 ± 0.325 | 5.109 ± 0.244 |
5.728 ± 0.222 | 7.39 ± 0.236 |
1.946 ± 0.139 | 2.915 ± 0.214 |
Most of the basic statistics you can see at this page can be downloaded from this CSV file
See this proteome in:

Proteome-pI is available under Creative Commons Attribution-NoDerivs license, for more details see here
| Reference: Kozlowski LP. Proteome-pI 2.0: Proteome Isoelectric Point Database Update. Nucleic Acids Res. 2021, doi: 10.1093/nar/gkab944 | Contact: Lukasz P. Kozlowski |