Streptomyces zinciresistens K42
Taxonomy: cellular organisms; Bacteria; Terrabacteria group; Actinobacteria; Actinomycetia; Streptomycetales; Streptomycetaceae; Streptomyces; Streptomyces zinciresistens
Average proteome isoelectric point is 6.62
Get precalculated fractions of proteins
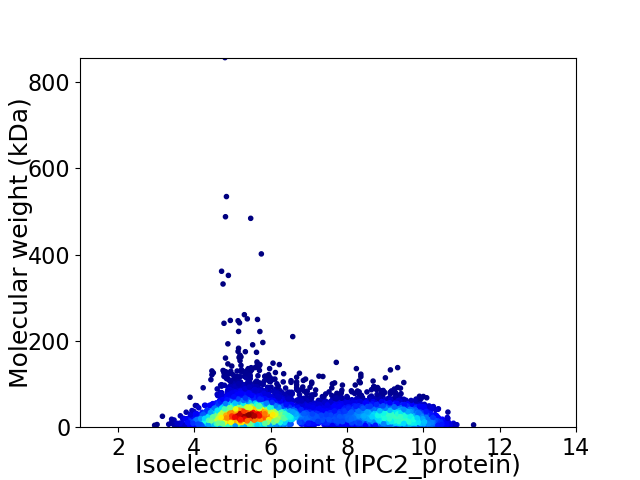
Virtual 2D-PAGE plot for 7577 proteins (isoelectric point calculated using IPC2_protein)
Get csv file with sequences according to given criteria:
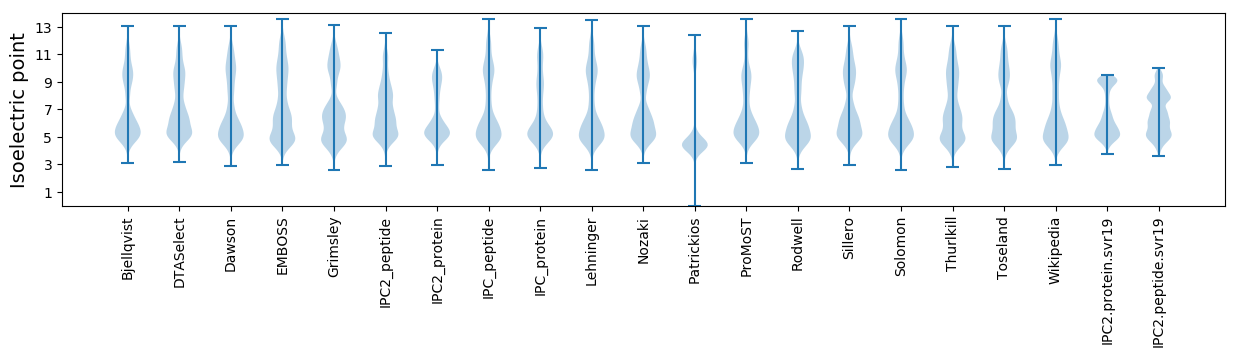
* You can choose from 21 different methods for calculating isoelectric point
Summary statistics related to proteome-wise predictions
Protein with the lowest isoelectric point:
>tr|G2G4Z1|G2G4Z1_9ACTN RNA polymerase sigma factor OS=Streptomyces zinciresistens K42 OX=700597 GN=SZN_02722 PE=4 SV=1
MM1 pKa = 7.25TPRR4 pKa = 11.84VTDD7 pKa = 2.98QGMRR11 pKa = 11.84TASASAAQDD20 pKa = 3.64PFDD23 pKa = 5.9LDD25 pKa = 3.14ISVIEE30 pKa = 4.22SGGTVGASIASDD42 pKa = 3.95GGCGSTCGGNACISSGSS59 pKa = 3.39
MM1 pKa = 7.25TPRR4 pKa = 11.84VTDD7 pKa = 2.98QGMRR11 pKa = 11.84TASASAAQDD20 pKa = 3.64PFDD23 pKa = 5.9LDD25 pKa = 3.14ISVIEE30 pKa = 4.22SGGTVGASIASDD42 pKa = 3.95GGCGSTCGGNACISSGSS59 pKa = 3.39
Molecular weight: 5.63 kDa
Isoelectric point according different methods:
Protein with the highest isoelectric point:
>tr|G2G7M4|G2G7M4_9ACTN Endo/exonuclease/phosphatase domain-containing protein OS=Streptomyces zinciresistens K42 OX=700597 GN=SZN_07437 PE=4 SV=1
MM1 pKa = 7.69SKK3 pKa = 9.0RR4 pKa = 11.84TFQPNNRR11 pKa = 11.84RR12 pKa = 11.84RR13 pKa = 11.84AKK15 pKa = 8.7THH17 pKa = 5.15GFRR20 pKa = 11.84LRR22 pKa = 11.84MRR24 pKa = 11.84TRR26 pKa = 11.84AGRR29 pKa = 11.84AILASRR35 pKa = 11.84RR36 pKa = 11.84SKK38 pKa = 10.75GRR40 pKa = 11.84ARR42 pKa = 11.84LSAA45 pKa = 3.91
MM1 pKa = 7.69SKK3 pKa = 9.0RR4 pKa = 11.84TFQPNNRR11 pKa = 11.84RR12 pKa = 11.84RR13 pKa = 11.84AKK15 pKa = 8.7THH17 pKa = 5.15GFRR20 pKa = 11.84LRR22 pKa = 11.84MRR24 pKa = 11.84TRR26 pKa = 11.84AGRR29 pKa = 11.84AILASRR35 pKa = 11.84RR36 pKa = 11.84SKK38 pKa = 10.75GRR40 pKa = 11.84ARR42 pKa = 11.84LSAA45 pKa = 3.91
Molecular weight: 5.28 kDa
Isoelectric point according different methods:
Peptides (in silico digests for buttom-up proteomics)
Below you can find in silico digests of the whole proteome with Trypsin, Chymotrypsin, Trypsin+LysC, LysN, ArgC proteases suitable for different mass spec machines.| Try ESI |
 |
|---|
| ChTry ESI |
|
|---|
| ArgC ESI |
|
|---|
| LysN ESI |
|
|---|
| TryLysC ESI |
|
|---|
| Try MALDI |
|
|---|
| ChTry MALDI |
|
|---|
| ArgC MALDI |
|
|---|
| LysN MALDI |
|
|---|
| TryLysC MALDI |
|
|---|
| Try LTQ |
|
|---|
| ChTry LTQ |
|
|---|
| ArgC LTQ |
|
|---|
| LysN LTQ |
|
|---|
| TryLysC LTQ |
|
|---|
| Try MSlow |
|
|---|
| ChTry MSlow |
|
|---|
| ArgC MSlow |
|
|---|
| LysN MSlow |
|
|---|
| TryLysC MSlow |
|
|---|
| Try MShigh |
|
|---|
| ChTry MShigh |
|
|---|
| ArgC MShigh |
|
|---|
| LysN MShigh |
|
|---|
| TryLysC MShigh |
|
|---|
General Statistics
Number of major isoforms |
Number of additional isoforms |
Number of all proteins |
Number of amino acids |
Min. Seq. Length |
Max. Seq. Length |
Avg. Seq. Length |
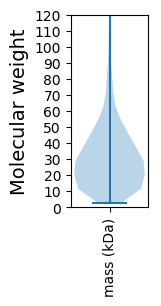
Avg. Mol. Weight |
|---|---|---|---|---|---|---|---|
0 |
2321544 |
30 |
8198 |
306.4 |
32.79 |
Amino acid frequency
Ala |
Cys |
Asp |
Glu |
Phe |
Gly |
His |
Ile |
Lys |
Leu |
|---|---|---|---|---|---|---|---|---|---|
14.019 ± 0.039 | 0.8 ± 0.008 |
5.992 ± 0.022 | 5.682 ± 0.026 |
2.634 ± 0.018 | 9.544 ± 0.033 |
2.266 ± 0.015 | 2.919 ± 0.02 |
2.04 ± 0.025 | 10.345 ± 0.033 |
Met |
Asn |
Gln |
Pro |
Arg |
Ser |
Thr |
Val |
Trp |
Tyr |
|---|---|---|---|---|---|---|---|---|---|
1.712 ± 0.012 | 1.657 ± 0.014 |
6.188 ± 0.025 | 2.749 ± 0.018 |
8.598 ± 0.037 | 4.898 ± 0.021 |
5.974 ± 0.023 | 8.444 ± 0.028 |
1.528 ± 0.012 | 2.008 ± 0.013 |
Most of the basic statistics you can see at this page can be downloaded from this CSV file
See this proteome in:

Proteome-pI is available under Creative Commons Attribution-NoDerivs license, for more details see here
| Reference: Kozlowski LP. Proteome-pI 2.0: Proteome Isoelectric Point Database Update. Nucleic Acids Res. 2021, doi: 10.1093/nar/gkab944 | Contact: Lukasz P. Kozlowski |