Aeromonas phage phiARM81mr
Taxonomy: Viruses; Duplodnaviria; Heunggongvirae; Uroviricota; Caudoviricetes; Caudovirales; Podoviridae; unclassified Podoviridae
Average proteome isoelectric point is 6.75
Get precalculated fractions of proteins
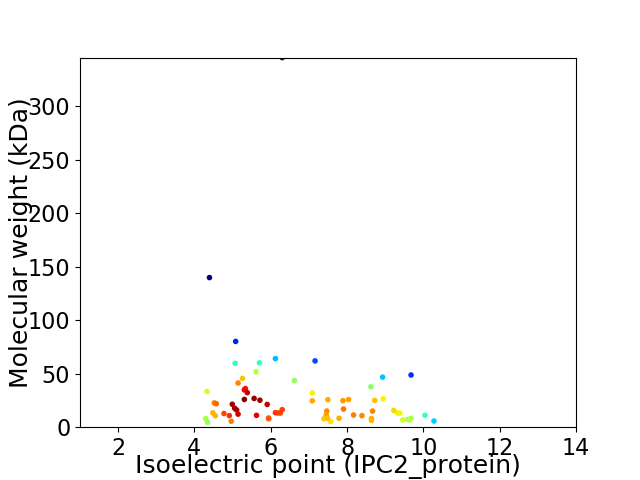
Virtual 2D-PAGE plot for 70 proteins (isoelectric point calculated using IPC2_protein)
Get csv file with sequences according to given criteria:
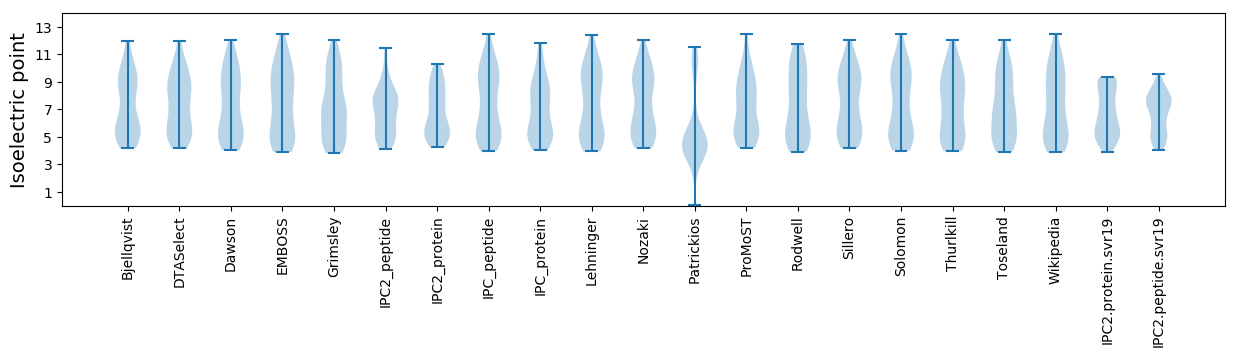
* You can choose from 21 different methods for calculating isoelectric point
Summary statistics related to proteome-wise predictions
Protein with the lowest isoelectric point:
>tr|A0A1I9KFC4|A0A1I9KFC4_9CAUD 23S rRNA-intervening sequence protein OS=Aeromonas phage phiARM81mr OX=1754209 GN=ARM81mr_p58 PE=4 SV=1
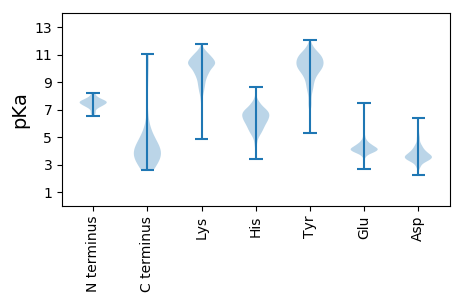
MM1 pKa = 7.63AGFVFLGNPQPTYY14 pKa = 8.75WTISMHH20 pKa = 6.09WSDD23 pKa = 4.21AVVNGITVTGVVTQVRR39 pKa = 11.84EE40 pKa = 4.14YY41 pKa = 10.94DD42 pKa = 3.41GSQALVTLNTGVSVVVPATHH62 pKa = 6.4EE63 pKa = 4.19PVPGDD68 pKa = 3.78AIVEE72 pKa = 4.45GEE74 pKa = 4.13LSLL77 pKa = 5.07
MM1 pKa = 7.63AGFVFLGNPQPTYY14 pKa = 8.75WTISMHH20 pKa = 6.09WSDD23 pKa = 4.21AVVNGITVTGVVTQVRR39 pKa = 11.84EE40 pKa = 4.14YY41 pKa = 10.94DD42 pKa = 3.41GSQALVTLNTGVSVVVPATHH62 pKa = 6.4EE63 pKa = 4.19PVPGDD68 pKa = 3.78AIVEE72 pKa = 4.45GEE74 pKa = 4.13LSLL77 pKa = 5.07
Molecular weight: 8.13 kDa
Isoelectric point according different methods:
Protein with the highest isoelectric point:
>tr|A0A1I9KFE6|A0A1I9KFE6_9CAUD Repressor OS=Aeromonas phage phiARM81mr OX=1754209 GN=ARM81mr_p07 PE=4 SV=1
MM1 pKa = 7.25GRR3 pKa = 11.84KK4 pKa = 8.82SDD6 pKa = 3.65RR7 pKa = 11.84PSRR10 pKa = 11.84AHH12 pKa = 6.2HH13 pKa = 6.49GDD15 pKa = 3.14RR16 pKa = 11.84GRR18 pKa = 11.84RR19 pKa = 11.84AAWLGVEE26 pKa = 4.5YY27 pKa = 10.9SHH29 pKa = 7.28GPRR32 pKa = 11.84PVCQVQEE39 pKa = 3.89QHH41 pKa = 5.53QGKK44 pKa = 7.0TVLVPRR50 pKa = 11.84PCAEE54 pKa = 3.8VLQPAKK60 pKa = 10.77
MM1 pKa = 7.25GRR3 pKa = 11.84KK4 pKa = 8.82SDD6 pKa = 3.65RR7 pKa = 11.84PSRR10 pKa = 11.84AHH12 pKa = 6.2HH13 pKa = 6.49GDD15 pKa = 3.14RR16 pKa = 11.84GRR18 pKa = 11.84RR19 pKa = 11.84AAWLGVEE26 pKa = 4.5YY27 pKa = 10.9SHH29 pKa = 7.28GPRR32 pKa = 11.84PVCQVQEE39 pKa = 3.89QHH41 pKa = 5.53QGKK44 pKa = 7.0TVLVPRR50 pKa = 11.84PCAEE54 pKa = 3.8VLQPAKK60 pKa = 10.77
Molecular weight: 6.72 kDa
Isoelectric point according different methods:
Peptides (in silico digests for buttom-up proteomics)
Below you can find in silico digests of the whole proteome with Trypsin, Chymotrypsin, Trypsin+LysC, LysN, ArgC proteases suitable for different mass spec machines.| Try ESI |
 |
|---|
| ChTry ESI |
|
|---|
| ArgC ESI |
|
|---|
| LysN ESI |
|
|---|
| TryLysC ESI |
|
|---|
| Try MALDI |
|
|---|
| ChTry MALDI |
|
|---|
| ArgC MALDI |
|
|---|
| LysN MALDI |
|
|---|
| TryLysC MALDI |
|
|---|
| Try LTQ |
|
|---|
| ChTry LTQ |
|
|---|
| ArgC LTQ |
|
|---|
| LysN LTQ |
|
|---|
| TryLysC LTQ |
|
|---|
| Try MSlow |
|
|---|
| ChTry MSlow |
|
|---|
| ArgC MSlow |
|
|---|
| LysN MSlow |
|
|---|
| TryLysC MSlow |
|
|---|
| Try MShigh |
|
|---|
| ChTry MShigh |
|
|---|
| ArgC MShigh |
|
|---|
| LysN MShigh |
|
|---|
| TryLysC MShigh |
|
|---|
General Statistics
Number of major isoforms |
Number of additional isoforms |
Number of all proteins |
Number of amino acids |
Min. Seq. Length |
Max. Seq. Length |
Avg. Seq. Length |
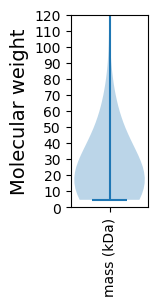
Avg. Mol. Weight |
|---|---|---|---|---|---|---|---|
0 |
18389 |
40 |
3190 |
262.7 |
28.92 |
Amino acid frequency
Ala |
Cys |
Asp |
Glu |
Phe |
Gly |
His |
Ile |
Lys |
Leu |
|---|---|---|---|---|---|---|---|---|---|
12.018 ± 0.478 | 1.055 ± 0.221 |
5.846 ± 0.249 | 6.874 ± 0.265 |
2.703 ± 0.154 | 7.466 ± 0.395 |
2.056 ± 0.236 | 4.394 ± 0.172 |
5.128 ± 0.312 | 8.315 ± 0.342 |
Met |
Asn |
Gln |
Pro |
Arg |
Ser |
Thr |
Val |
Trp |
Tyr |
|---|---|---|---|---|---|---|---|---|---|
2.806 ± 0.2 | 3.622 ± 0.169 |
4.427 ± 0.267 | 5.346 ± 0.354 |
6.738 ± 0.265 | 5.683 ± 0.305 |
5.607 ± 0.292 | 6.047 ± 0.246 |
1.485 ± 0.124 | 2.387 ± 0.145 |
Most of the basic statistics you can see at this page can be downloaded from this CSV file
See this proteome in:

Proteome-pI is available under Creative Commons Attribution-NoDerivs license, for more details see here
| Reference: Kozlowski LP. Proteome-pI 2.0: Proteome Isoelectric Point Database Update. Nucleic Acids Res. 2021, doi: 10.1093/nar/gkab944 | Contact: Lukasz P. Kozlowski |