Lysobacter silvestris
Taxonomy: cellular organisms; Bacteria; Proteobacteria; Gammaproteobacteria; Xanthomonadales; Xanthomonadaceae; Lysobacter
Average proteome isoelectric point is 6.72
Get precalculated fractions of proteins
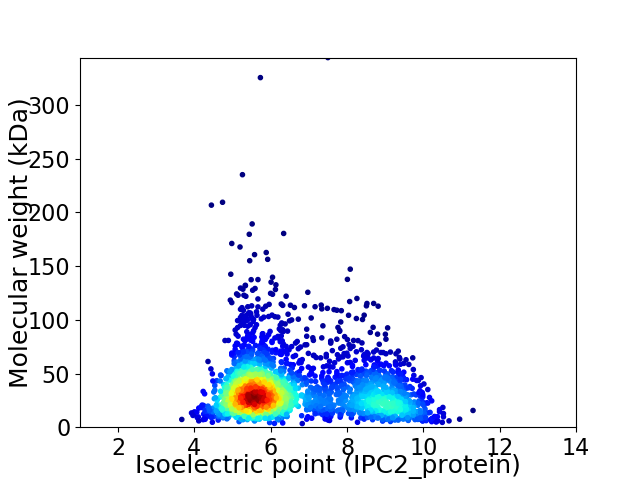
Virtual 2D-PAGE plot for 2544 proteins (isoelectric point calculated using IPC2_protein)
Get csv file with sequences according to given criteria:
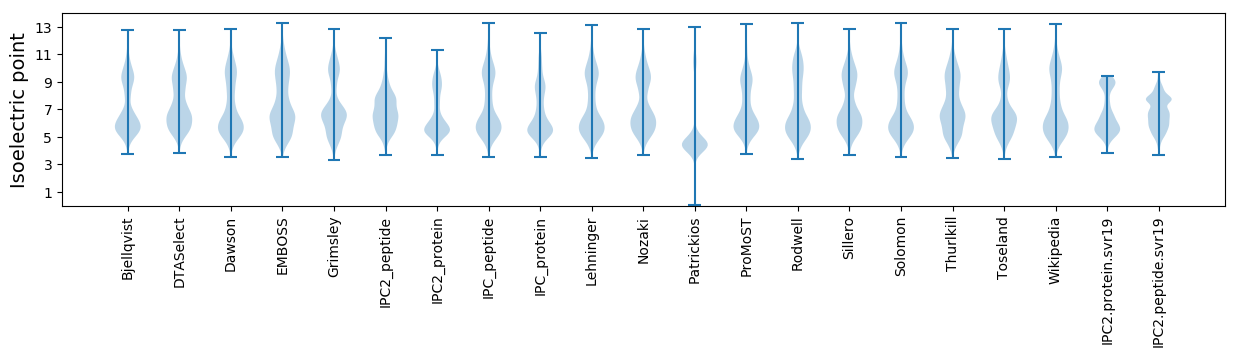
* You can choose from 21 different methods for calculating isoelectric point
Summary statistics related to proteome-wise predictions
Protein with the lowest isoelectric point:
>tr|A0A2K1Q089|A0A2K1Q089_9GAMM Putative transcriptional regulator OS=Lysobacter silvestris OX=1645665 GN=Lysil_0087 PE=4 SV=1
MM1 pKa = 7.68SEE3 pKa = 4.08LAVAADD9 pKa = 3.81TPFRR13 pKa = 11.84TWMCVVCGFIYY24 pKa = 10.64DD25 pKa = 3.83EE26 pKa = 4.46ALGLPEE32 pKa = 4.87EE33 pKa = 4.64GLAAGTRR40 pKa = 11.84WEE42 pKa = 5.6DD43 pKa = 4.49IPDD46 pKa = 3.14TWTCPDD52 pKa = 3.91CGVTKK57 pKa = 10.68DD58 pKa = 3.96DD59 pKa = 5.22FEE61 pKa = 4.29MTEE64 pKa = 3.7II65 pKa = 4.61
MM1 pKa = 7.68SEE3 pKa = 4.08LAVAADD9 pKa = 3.81TPFRR13 pKa = 11.84TWMCVVCGFIYY24 pKa = 10.64DD25 pKa = 3.83EE26 pKa = 4.46ALGLPEE32 pKa = 4.87EE33 pKa = 4.64GLAAGTRR40 pKa = 11.84WEE42 pKa = 5.6DD43 pKa = 4.49IPDD46 pKa = 3.14TWTCPDD52 pKa = 3.91CGVTKK57 pKa = 10.68DD58 pKa = 3.96DD59 pKa = 5.22FEE61 pKa = 4.29MTEE64 pKa = 3.7II65 pKa = 4.61
Molecular weight: 7.22 kDa
Isoelectric point according different methods:
Protein with the highest isoelectric point:
>tr|A0A2K1PZE9|A0A2K1PZE9_9GAMM Uncharacterized protein OS=Lysobacter silvestris OX=1645665 GN=Lysil_2340 PE=4 SV=1
MM1 pKa = 7.58NIGATARR8 pKa = 11.84RR9 pKa = 11.84HH10 pKa = 4.6GTTALLSLAIAGFGTATALAGSPVAQAVAPVAAVKK45 pKa = 10.05AHH47 pKa = 5.74PTSGKK52 pKa = 9.2ASRR55 pKa = 11.84IVRR58 pKa = 11.84IRR60 pKa = 11.84QAQAVPFFAFPPRR73 pKa = 11.84II74 pKa = 3.66
MM1 pKa = 7.58NIGATARR8 pKa = 11.84RR9 pKa = 11.84HH10 pKa = 4.6GTTALLSLAIAGFGTATALAGSPVAQAVAPVAAVKK45 pKa = 10.05AHH47 pKa = 5.74PTSGKK52 pKa = 9.2ASRR55 pKa = 11.84IVRR58 pKa = 11.84IRR60 pKa = 11.84QAQAVPFFAFPPRR73 pKa = 11.84II74 pKa = 3.66
Molecular weight: 7.48 kDa
Isoelectric point according different methods:
Peptides (in silico digests for buttom-up proteomics)
Below you can find in silico digests of the whole proteome with Trypsin, Chymotrypsin, Trypsin+LysC, LysN, ArgC proteases suitable for different mass spec machines.| Try ESI |
 |
|---|
| ChTry ESI |
|
|---|
| ArgC ESI |
|
|---|
| LysN ESI |
|
|---|
| TryLysC ESI |
|
|---|
| Try MALDI |
|
|---|
| ChTry MALDI |
|
|---|
| ArgC MALDI |
|
|---|
| LysN MALDI |
|
|---|
| TryLysC MALDI |
|
|---|
| Try LTQ |
|
|---|
| ChTry LTQ |
|
|---|
| ArgC LTQ |
|
|---|
| LysN LTQ |
|
|---|
| TryLysC LTQ |
|
|---|
| Try MSlow |
|
|---|
| ChTry MSlow |
|
|---|
| ArgC MSlow |
|
|---|
| LysN MSlow |
|
|---|
| TryLysC MSlow |
|
|---|
| Try MShigh |
|
|---|
| ChTry MShigh |
|
|---|
| ArgC MShigh |
|
|---|
| LysN MShigh |
|
|---|
| TryLysC MShigh |
|
|---|
General Statistics
Number of major isoforms |
Number of additional isoforms |
Number of all proteins |
Number of amino acids |
Min. Seq. Length |
Max. Seq. Length |
Avg. Seq. Length |
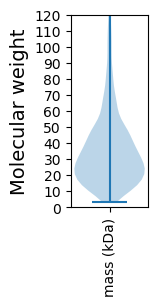
Avg. Mol. Weight |
|---|---|---|---|---|---|---|---|
0 |
874491 |
30 |
3684 |
343.7 |
37.42 |
Amino acid frequency
Ala |
Cys |
Asp |
Glu |
Phe |
Gly |
His |
Ile |
Lys |
Leu |
|---|---|---|---|---|---|---|---|---|---|
12.369 ± 0.069 | 0.847 ± 0.016 |
6.126 ± 0.038 | 4.964 ± 0.053 |
3.401 ± 0.031 | 8.471 ± 0.078 |
2.436 ± 0.028 | 4.717 ± 0.032 |
3.228 ± 0.045 | 10.267 ± 0.064 |
Met |
Asn |
Gln |
Pro |
Arg |
Ser |
Thr |
Val |
Trp |
Tyr |
|---|---|---|---|---|---|---|---|---|---|
2.399 ± 0.027 | 2.848 ± 0.052 |
5.177 ± 0.033 | 3.72 ± 0.032 |
7.222 ± 0.062 | 5.386 ± 0.038 |
5.235 ± 0.064 | 7.28 ± 0.042 |
1.519 ± 0.025 | 2.387 ± 0.035 |
Most of the basic statistics you can see at this page can be downloaded from this CSV file
See this proteome in:

Proteome-pI is available under Creative Commons Attribution-NoDerivs license, for more details see here
| Reference: Kozlowski LP. Proteome-pI 2.0: Proteome Isoelectric Point Database Update. Nucleic Acids Res. 2021, doi: 10.1093/nar/gkab944 | Contact: Lukasz P. Kozlowski |