Ralstonia phage RP13
Taxonomy: Viruses; Duplodnaviria; Heunggongvirae; Uroviricota; Caudoviricetes; Caudovirales; Myoviridae; unclassified Myoviridae
Average proteome isoelectric point is 6.25
Get precalculated fractions of proteins
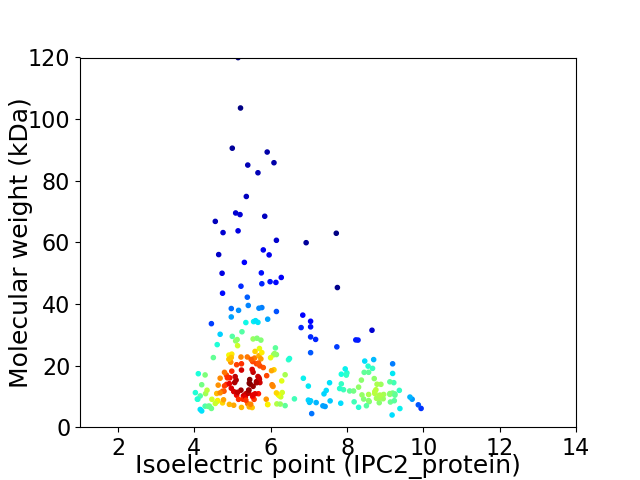
Virtual 2D-PAGE plot for 264 proteins (isoelectric point calculated using IPC2_protein)
Get csv file with sequences according to given criteria:
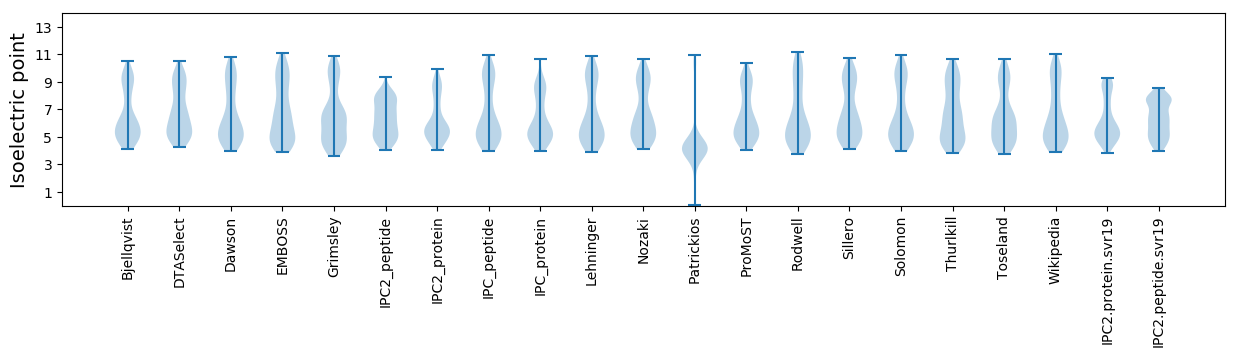
* You can choose from 21 different methods for calculating isoelectric point
Summary statistics related to proteome-wise predictions
Protein with the lowest isoelectric point:
>tr|A0A6J4EGN9|A0A6J4EGN9_9CAUD Uncharacterized protein OS=Ralstonia phage RP13 OX=2743402 PE=4 SV=1
MM1 pKa = 7.57LSISNLGIVNDD12 pKa = 3.82VKK14 pKa = 11.02ALQLSSIYY22 pKa = 10.1QIQSGLDD29 pKa = 3.33SLDD32 pKa = 3.75IIAITLFGDD41 pKa = 3.37QNYY44 pKa = 7.95WKK46 pKa = 10.61YY47 pKa = 10.3LAYY50 pKa = 11.01YY51 pKa = 10.29NDD53 pKa = 3.28IEE55 pKa = 4.59NPFGLISQGYY65 pKa = 6.82TSIKK69 pKa = 10.18VFSKK73 pKa = 11.06SDD75 pKa = 3.09IDD77 pKa = 4.5LLINN81 pKa = 4.03
MM1 pKa = 7.57LSISNLGIVNDD12 pKa = 3.82VKK14 pKa = 11.02ALQLSSIYY22 pKa = 10.1QIQSGLDD29 pKa = 3.33SLDD32 pKa = 3.75IIAITLFGDD41 pKa = 3.37QNYY44 pKa = 7.95WKK46 pKa = 10.61YY47 pKa = 10.3LAYY50 pKa = 11.01YY51 pKa = 10.29NDD53 pKa = 3.28IEE55 pKa = 4.59NPFGLISQGYY65 pKa = 6.82TSIKK69 pKa = 10.18VFSKK73 pKa = 11.06SDD75 pKa = 3.09IDD77 pKa = 4.5LLINN81 pKa = 4.03
Molecular weight: 9.1 kDa
Isoelectric point according different methods:
Protein with the highest isoelectric point:
>tr|A0A6J4EGK9|A0A6J4EGK9_9CAUD Uncharacterized protein OS=Ralstonia phage RP13 OX=2743402 PE=4 SV=1
MM1 pKa = 7.07NSKK4 pKa = 8.86YY5 pKa = 9.41QRR7 pKa = 11.84FFAHH11 pKa = 5.76VRR13 pKa = 11.84SGYY16 pKa = 7.99VTVVHH21 pKa = 6.54HH22 pKa = 6.15GVMMVDD28 pKa = 3.23VLVGTGANVSIKK40 pKa = 10.5HH41 pKa = 6.33LLTADD46 pKa = 4.47EE47 pKa = 4.8ISHH50 pKa = 6.77LGNRR54 pKa = 11.84IQQRR58 pKa = 11.84VKK60 pKa = 10.59AARR63 pKa = 11.84HH64 pKa = 4.57AA65 pKa = 4.02
MM1 pKa = 7.07NSKK4 pKa = 8.86YY5 pKa = 9.41QRR7 pKa = 11.84FFAHH11 pKa = 5.76VRR13 pKa = 11.84SGYY16 pKa = 7.99VTVVHH21 pKa = 6.54HH22 pKa = 6.15GVMMVDD28 pKa = 3.23VLVGTGANVSIKK40 pKa = 10.5HH41 pKa = 6.33LLTADD46 pKa = 4.47EE47 pKa = 4.8ISHH50 pKa = 6.77LGNRR54 pKa = 11.84IQQRR58 pKa = 11.84VKK60 pKa = 10.59AARR63 pKa = 11.84HH64 pKa = 4.57AA65 pKa = 4.02
Molecular weight: 7.25 kDa
Isoelectric point according different methods:
Peptides (in silico digests for buttom-up proteomics)
Below you can find in silico digests of the whole proteome with Trypsin, Chymotrypsin, Trypsin+LysC, LysN, ArgC proteases suitable for different mass spec machines.| Try ESI |
 |
|---|
| ChTry ESI |
|
|---|
| ArgC ESI |
|
|---|
| LysN ESI |
|
|---|
| TryLysC ESI |
|
|---|
| Try MALDI |
|
|---|
| ChTry MALDI |
|
|---|
| ArgC MALDI |
|
|---|
| LysN MALDI |
|
|---|
| TryLysC MALDI |
|
|---|
| Try LTQ |
|
|---|
| ChTry LTQ |
|
|---|
| ArgC LTQ |
|
|---|
| LysN LTQ |
|
|---|
| TryLysC LTQ |
|
|---|
| Try MSlow |
|
|---|
| ChTry MSlow |
|
|---|
| ArgC MSlow |
|
|---|
| LysN MSlow |
|
|---|
| TryLysC MSlow |
|
|---|
| Try MShigh |
|
|---|
| ChTry MShigh |
|
|---|
| ArgC MShigh |
|
|---|
| LysN MShigh |
|
|---|
| TryLysC MShigh |
|
|---|
General Statistics
Number of major isoforms |
Number of additional isoforms |
Number of all proteins |
Number of amino acids |
Min. Seq. Length |
Max. Seq. Length |
Avg. Seq. Length |
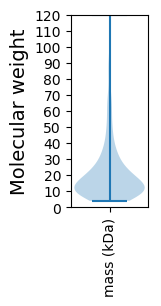
Avg. Mol. Weight |
|---|---|---|---|---|---|---|---|
0 |
50946 |
36 |
1059 |
193.0 |
21.69 |
Amino acid frequency
Ala |
Cys |
Asp |
Glu |
Phe |
Gly |
His |
Ile |
Lys |
Leu |
|---|---|---|---|---|---|---|---|---|---|
7.215 ± 0.187 | 1.076 ± 0.058 |
6.401 ± 0.125 | 5.834 ± 0.191 |
3.735 ± 0.091 | 6.038 ± 0.169 |
2.232 ± 0.094 | 7.125 ± 0.148 |
6.475 ± 0.177 | 8.281 ± 0.166 |
Met |
Asn |
Gln |
Pro |
Arg |
Ser |
Thr |
Val |
Trp |
Tyr |
|---|---|---|---|---|---|---|---|---|---|
2.683 ± 0.095 | 5.555 ± 0.138 |
3.806 ± 0.111 | 3.771 ± 0.107 |
4.328 ± 0.117 | 6.782 ± 0.17 |
6.393 ± 0.157 | 6.839 ± 0.152 |
1.229 ± 0.066 | 4.202 ± 0.112 |
Most of the basic statistics you can see at this page can be downloaded from this CSV file
See this proteome in:

Proteome-pI is available under Creative Commons Attribution-NoDerivs license, for more details see here
| Reference: Kozlowski LP. Proteome-pI 2.0: Proteome Isoelectric Point Database Update. Nucleic Acids Res. 2021, doi: 10.1093/nar/gkab944 | Contact: Lukasz P. Kozlowski |