Simian immunodeficiency virus (isolate TAN1) (SIV-cpz) (Chimpanzee immunodeficiency virus)
Taxonomy: Viruses; Riboviria; Pararnavirae; Artverviricota; Revtraviricetes; Ortervirales; Retroviridae; Orthoretrovirinae; Lentivirus; Simian immunodeficiency virus; Simian immunodeficiency virus - cpz
Average proteome isoelectric point is 7.39
Get precalculated fractions of proteins
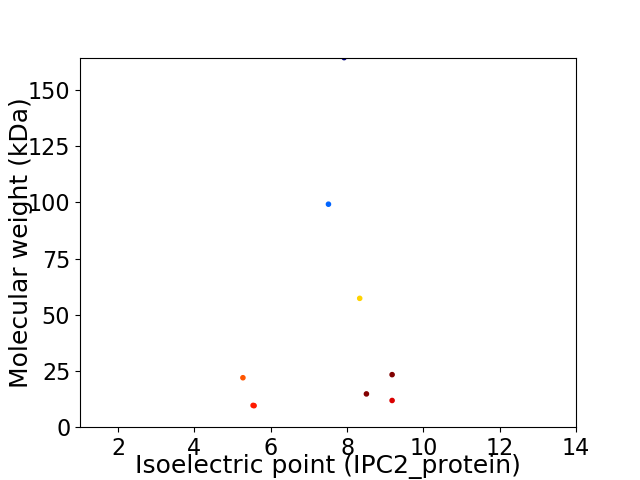
Virtual 2D-PAGE plot for 9 proteins (isoelectric point calculated using IPC2_protein)
Get csv file with sequences according to given criteria:
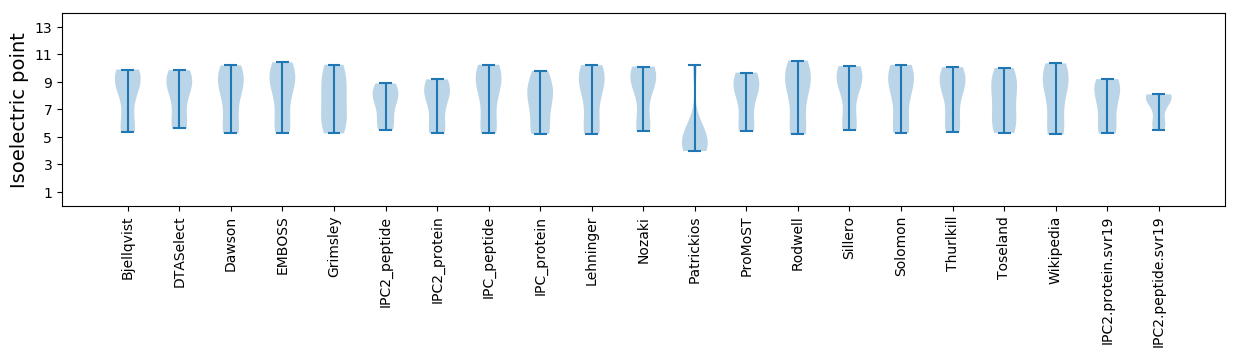
* You can choose from 21 different methods for calculating isoelectric point
Summary statistics related to proteome-wise predictions
Protein with the lowest isoelectric point:
>sp|Q8AIH5|ENV_SIVTN Envelope glycoprotein gp160 OS=Simian immunodeficiency virus (isolate TAN1) OX=388910 PE=3 SV=1
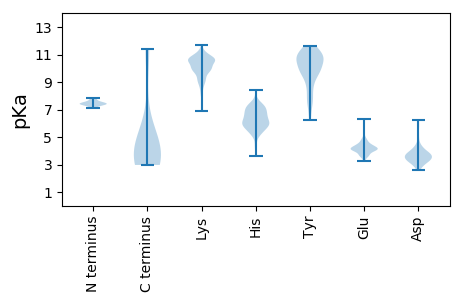
MM1 pKa = 7.42GNIFGRR7 pKa = 11.84WPGARR12 pKa = 11.84KK13 pKa = 9.84AIEE16 pKa = 4.53DD17 pKa = 3.54LHH19 pKa = 5.83NTSSEE24 pKa = 4.2PVGQASQDD32 pKa = 3.71LQNKK36 pKa = 9.46GGLTTNTLGTSADD49 pKa = 3.63VLEE52 pKa = 4.68YY53 pKa = 10.85SADD56 pKa = 3.53HH57 pKa = 6.39TEE59 pKa = 4.24EE60 pKa = 4.03EE61 pKa = 4.3VGFPVRR67 pKa = 11.84PAVPMRR73 pKa = 11.84PMTEE77 pKa = 3.6KK78 pKa = 10.9LAIDD82 pKa = 4.17LSWFLKK88 pKa = 10.56EE89 pKa = 4.98KK90 pKa = 10.83GGLDD94 pKa = 3.53GLFFSPKK101 pKa = 9.16RR102 pKa = 11.84AAILDD107 pKa = 3.27TWMYY111 pKa = 7.97NTQGVFPDD119 pKa = 3.52WQNYY123 pKa = 6.27TPGPGIRR130 pKa = 11.84YY131 pKa = 6.31PLCRR135 pKa = 11.84GWLFKK140 pKa = 10.51LVPVDD145 pKa = 4.21PPEE148 pKa = 5.57DD149 pKa = 3.65DD150 pKa = 3.69EE151 pKa = 6.28KK152 pKa = 11.7NILLHH157 pKa = 6.17PACSHH162 pKa = 5.89GTTDD166 pKa = 4.29PDD168 pKa = 4.01GEE170 pKa = 4.35TLIWRR175 pKa = 11.84FDD177 pKa = 3.12SSLARR182 pKa = 11.84RR183 pKa = 11.84HH184 pKa = 5.57IARR187 pKa = 11.84EE188 pKa = 3.73RR189 pKa = 11.84YY190 pKa = 9.02PEE192 pKa = 3.96YY193 pKa = 10.8FKK195 pKa = 11.43
MM1 pKa = 7.42GNIFGRR7 pKa = 11.84WPGARR12 pKa = 11.84KK13 pKa = 9.84AIEE16 pKa = 4.53DD17 pKa = 3.54LHH19 pKa = 5.83NTSSEE24 pKa = 4.2PVGQASQDD32 pKa = 3.71LQNKK36 pKa = 9.46GGLTTNTLGTSADD49 pKa = 3.63VLEE52 pKa = 4.68YY53 pKa = 10.85SADD56 pKa = 3.53HH57 pKa = 6.39TEE59 pKa = 4.24EE60 pKa = 4.03EE61 pKa = 4.3VGFPVRR67 pKa = 11.84PAVPMRR73 pKa = 11.84PMTEE77 pKa = 3.6KK78 pKa = 10.9LAIDD82 pKa = 4.17LSWFLKK88 pKa = 10.56EE89 pKa = 4.98KK90 pKa = 10.83GGLDD94 pKa = 3.53GLFFSPKK101 pKa = 9.16RR102 pKa = 11.84AAILDD107 pKa = 3.27TWMYY111 pKa = 7.97NTQGVFPDD119 pKa = 3.52WQNYY123 pKa = 6.27TPGPGIRR130 pKa = 11.84YY131 pKa = 6.31PLCRR135 pKa = 11.84GWLFKK140 pKa = 10.51LVPVDD145 pKa = 4.21PPEE148 pKa = 5.57DD149 pKa = 3.65DD150 pKa = 3.69EE151 pKa = 6.28KK152 pKa = 11.7NILLHH157 pKa = 6.17PACSHH162 pKa = 5.89GTTDD166 pKa = 4.29PDD168 pKa = 4.01GEE170 pKa = 4.35TLIWRR175 pKa = 11.84FDD177 pKa = 3.12SSLARR182 pKa = 11.84RR183 pKa = 11.84HH184 pKa = 5.57IARR187 pKa = 11.84EE188 pKa = 3.73RR189 pKa = 11.84YY190 pKa = 9.02PEE192 pKa = 3.96YY193 pKa = 10.8FKK195 pKa = 11.43
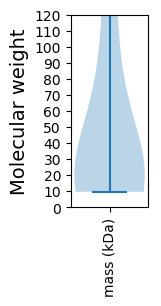
Molecular weight: 22.01 kDa
Isoelectric point according different methods:
Protein with the highest isoelectric point:
>sp|Q8AII1|POL_SIVTN Gag-Pol polyprotein OS=Simian immunodeficiency virus (isolate TAN1) OX=388910 GN=gag-pol PE=3 SV=4
MM1 pKa = 7.37EE2 pKa = 5.44NRR4 pKa = 11.84WQVQVVWMIDD14 pKa = 3.18RR15 pKa = 11.84MRR17 pKa = 11.84LRR19 pKa = 11.84TWTSLVKK26 pKa = 10.14HH27 pKa = 6.62HH28 pKa = 7.12IFTTKK33 pKa = 10.04CCKK36 pKa = 8.91DD37 pKa = 2.85WKK39 pKa = 10.1YY40 pKa = 10.01RR41 pKa = 11.84HH42 pKa = 6.56HH43 pKa = 7.26YY44 pKa = 7.8EE45 pKa = 3.47TDD47 pKa = 3.08TPKK50 pKa = 10.6RR51 pKa = 11.84AGEE54 pKa = 3.56IHH56 pKa = 6.61IPLTEE61 pKa = 3.94RR62 pKa = 11.84SKK64 pKa = 11.31LVVLHH69 pKa = 5.82YY70 pKa = 10.09WGLACGEE77 pKa = 4.38RR78 pKa = 11.84PWHH81 pKa = 6.25LGHH84 pKa = 7.63GIGLEE89 pKa = 3.94WRR91 pKa = 11.84QGKK94 pKa = 10.0YY95 pKa = 7.57STQIDD100 pKa = 4.69PEE102 pKa = 4.29TADD105 pKa = 3.39QLIHH109 pKa = 5.82TRR111 pKa = 11.84YY112 pKa = 6.72FTCFAAGAVRR122 pKa = 11.84QAILGEE128 pKa = 4.42RR129 pKa = 11.84ILTFCHH135 pKa = 5.86FQSGHH140 pKa = 5.15RR141 pKa = 11.84QVGTLQFLAFRR152 pKa = 11.84KK153 pKa = 9.83VVEE156 pKa = 4.56SQDD159 pKa = 3.7KK160 pKa = 9.68QPKK163 pKa = 8.73GPRR166 pKa = 11.84RR167 pKa = 11.84PLPSVTKK174 pKa = 9.59LTEE177 pKa = 4.22DD178 pKa = 2.74RR179 pKa = 11.84WNKK182 pKa = 9.53HH183 pKa = 3.62RR184 pKa = 11.84TTTGRR189 pKa = 11.84RR190 pKa = 11.84EE191 pKa = 3.63NHH193 pKa = 5.95TLSGCC198 pKa = 3.61
MM1 pKa = 7.37EE2 pKa = 5.44NRR4 pKa = 11.84WQVQVVWMIDD14 pKa = 3.18RR15 pKa = 11.84MRR17 pKa = 11.84LRR19 pKa = 11.84TWTSLVKK26 pKa = 10.14HH27 pKa = 6.62HH28 pKa = 7.12IFTTKK33 pKa = 10.04CCKK36 pKa = 8.91DD37 pKa = 2.85WKK39 pKa = 10.1YY40 pKa = 10.01RR41 pKa = 11.84HH42 pKa = 6.56HH43 pKa = 7.26YY44 pKa = 7.8EE45 pKa = 3.47TDD47 pKa = 3.08TPKK50 pKa = 10.6RR51 pKa = 11.84AGEE54 pKa = 3.56IHH56 pKa = 6.61IPLTEE61 pKa = 3.94RR62 pKa = 11.84SKK64 pKa = 11.31LVVLHH69 pKa = 5.82YY70 pKa = 10.09WGLACGEE77 pKa = 4.38RR78 pKa = 11.84PWHH81 pKa = 6.25LGHH84 pKa = 7.63GIGLEE89 pKa = 3.94WRR91 pKa = 11.84QGKK94 pKa = 10.0YY95 pKa = 7.57STQIDD100 pKa = 4.69PEE102 pKa = 4.29TADD105 pKa = 3.39QLIHH109 pKa = 5.82TRR111 pKa = 11.84YY112 pKa = 6.72FTCFAAGAVRR122 pKa = 11.84QAILGEE128 pKa = 4.42RR129 pKa = 11.84ILTFCHH135 pKa = 5.86FQSGHH140 pKa = 5.15RR141 pKa = 11.84QVGTLQFLAFRR152 pKa = 11.84KK153 pKa = 9.83VVEE156 pKa = 4.56SQDD159 pKa = 3.7KK160 pKa = 9.68QPKK163 pKa = 8.73GPRR166 pKa = 11.84RR167 pKa = 11.84PLPSVTKK174 pKa = 9.59LTEE177 pKa = 4.22DD178 pKa = 2.74RR179 pKa = 11.84WNKK182 pKa = 9.53HH183 pKa = 3.62RR184 pKa = 11.84TTTGRR189 pKa = 11.84RR190 pKa = 11.84EE191 pKa = 3.63NHH193 pKa = 5.95TLSGCC198 pKa = 3.61
Molecular weight: 23.38 kDa
Isoelectric point according different methods:
Peptides (in silico digests for buttom-up proteomics)
Below you can find in silico digests of the whole proteome with Trypsin, Chymotrypsin, Trypsin+LysC, LysN, ArgC proteases suitable for different mass spec machines.| Try ESI |
 |
|---|
| ChTry ESI |
|
|---|
| ArgC ESI |
|
|---|
| LysN ESI |
|
|---|
| TryLysC ESI |
|
|---|
| Try MALDI |
|
|---|
| ChTry MALDI |
|
|---|
| ArgC MALDI |
|
|---|
| LysN MALDI |
|
|---|
| TryLysC MALDI |
|
|---|
| Try LTQ |
|
|---|
| ChTry LTQ |
|
|---|
| ArgC LTQ |
|
|---|
| LysN LTQ |
|
|---|
| TryLysC LTQ |
|
|---|
| Try MSlow |
|
|---|
| ChTry MSlow |
|
|---|
| ArgC MSlow |
|
|---|
| LysN MSlow |
|
|---|
| TryLysC MSlow |
|
|---|
| Try MShigh |
|
|---|
| ChTry MShigh |
|
|---|
| ArgC MShigh |
|
|---|
| LysN MShigh |
|
|---|
| TryLysC MShigh |
|
|---|
General Statistics
Number of major isoforms |
Number of additional isoforms |
Number of all proteins |
Number of amino acids |
Min. Seq. Length |
Max. Seq. Length |
Avg. Seq. Length |
Avg. Mol. Weight |
|---|---|---|---|---|---|---|---|
0 |
3657 |
83 |
1462 |
406.3 |
45.81 |
Amino acid frequency
Ala |
Cys |
Asp |
Glu |
Phe |
Gly |
His |
Ile |
Lys |
Leu |
|---|---|---|---|---|---|---|---|---|---|
6.289 ± 0.428 | 2.024 ± 0.295 |
4.02 ± 0.36 | 6.317 ± 0.518 |
2.707 ± 0.357 | 7.711 ± 0.635 |
2.352 ± 0.447 | 6.563 ± 0.703 |
6.153 ± 0.9 | 8.094 ± 0.492 |
Met |
Asn |
Gln |
Pro |
Arg |
Ser |
Thr |
Val |
Trp |
Tyr |
|---|---|---|---|---|---|---|---|---|---|
1.996 ± 0.285 | 5.004 ± 0.723 |
5.496 ± 0.599 | 5.961 ± 0.312 |
5.688 ± 0.798 | 5.141 ± 0.731 |
6.836 ± 0.535 | 6.125 ± 0.407 |
2.707 ± 0.291 | 2.817 ± 0.33 |
Most of the basic statistics you can see at this page can be downloaded from this CSV file
See this proteome in:

Proteome-pI is available under Creative Commons Attribution-NoDerivs license, for more details see here
| Reference: Kozlowski LP. Proteome-pI 2.0: Proteome Isoelectric Point Database Update. Nucleic Acids Res. 2021, doi: 10.1093/nar/gkab944 | Contact: Lukasz P. Kozlowski |