Escherichia phage IME11
Taxonomy: Viruses; Duplodnaviria; Heunggongvirae; Uroviricota; Caudoviricetes; Caudovirales; Schitoviridae; Enquatrovirinae; Gamaleyavirus; Escherichia virus IME11
Average proteome isoelectric point is 6.34
Get precalculated fractions of proteins
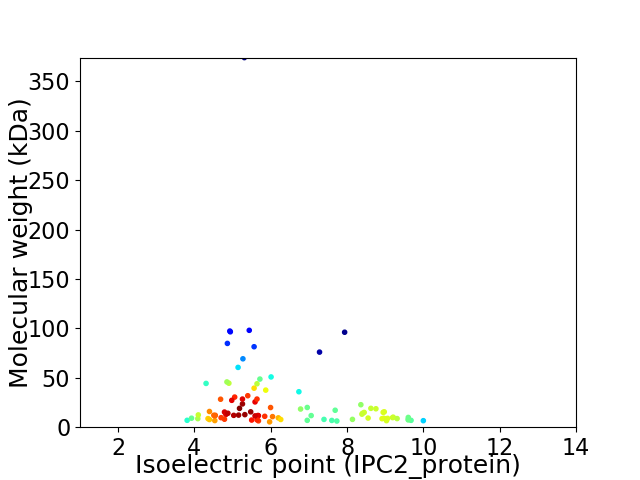
Virtual 2D-PAGE plot for 91 proteins (isoelectric point calculated using IPC2_protein)
Get csv file with sequences according to given criteria:
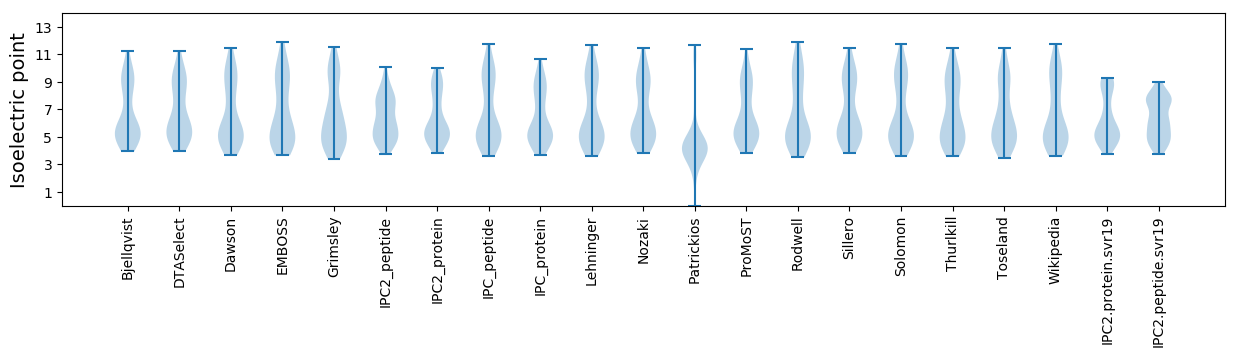
* You can choose from 21 different methods for calculating isoelectric point
Summary statistics related to proteome-wise predictions
Protein with the lowest isoelectric point:
>tr|K4MPX4|K4MPX4_9CAUD Portal protein OS=Escherichia phage IME11 OX=1239384 GN=IME11_7 PE=4 SV=1
MM1 pKa = 7.49ALKK4 pKa = 9.0FTFDD8 pKa = 3.76FNGITVNDD16 pKa = 4.12GVLTVSKK23 pKa = 10.41PMIDD27 pKa = 3.97GEE29 pKa = 4.56SGTITFGLLFQATSADD45 pKa = 3.81PLLKK49 pKa = 10.37SVTLSCPYY57 pKa = 10.76DD58 pKa = 3.7PFGADD63 pKa = 3.94PFTQAYY69 pKa = 9.83AYY71 pKa = 9.66IKK73 pKa = 10.31SLPDD77 pKa = 3.22YY78 pKa = 10.51EE79 pKa = 4.46SAEE82 pKa = 4.4EE83 pKa = 3.93II84 pKa = 4.27
MM1 pKa = 7.49ALKK4 pKa = 9.0FTFDD8 pKa = 3.76FNGITVNDD16 pKa = 4.12GVLTVSKK23 pKa = 10.41PMIDD27 pKa = 3.97GEE29 pKa = 4.56SGTITFGLLFQATSADD45 pKa = 3.81PLLKK49 pKa = 10.37SVTLSCPYY57 pKa = 10.76DD58 pKa = 3.7PFGADD63 pKa = 3.94PFTQAYY69 pKa = 9.83AYY71 pKa = 9.66IKK73 pKa = 10.31SLPDD77 pKa = 3.22YY78 pKa = 10.51EE79 pKa = 4.46SAEE82 pKa = 4.4EE83 pKa = 3.93II84 pKa = 4.27
Molecular weight: 9.09 kDa
Isoelectric point according different methods:
Protein with the highest isoelectric point:
>tr|K4MMF8|K4MMF8_9CAUD Uncharacterized protein OS=Escherichia phage IME11 OX=1239384 GN=IME11_76 PE=4 SV=1
MM1 pKa = 7.67RR2 pKa = 11.84KK3 pKa = 9.51SLIMGTKK10 pKa = 9.56EE11 pKa = 3.52DD12 pKa = 3.56VSRR15 pKa = 11.84MRR17 pKa = 11.84NRR19 pKa = 11.84NVASKK24 pKa = 10.45RR25 pKa = 11.84ALSMTNEE32 pKa = 3.92QLQEE36 pKa = 4.45FIDD39 pKa = 4.23AGLKK43 pKa = 8.89QSKK46 pKa = 10.24ARR48 pKa = 11.84IVTFNHH54 pKa = 6.58PSILGNNN61 pKa = 3.73
MM1 pKa = 7.67RR2 pKa = 11.84KK3 pKa = 9.51SLIMGTKK10 pKa = 9.56EE11 pKa = 3.52DD12 pKa = 3.56VSRR15 pKa = 11.84MRR17 pKa = 11.84NRR19 pKa = 11.84NVASKK24 pKa = 10.45RR25 pKa = 11.84ALSMTNEE32 pKa = 3.92QLQEE36 pKa = 4.45FIDD39 pKa = 4.23AGLKK43 pKa = 8.89QSKK46 pKa = 10.24ARR48 pKa = 11.84IVTFNHH54 pKa = 6.58PSILGNNN61 pKa = 3.73
Molecular weight: 6.93 kDa
Isoelectric point according different methods:
Peptides (in silico digests for buttom-up proteomics)
Below you can find in silico digests of the whole proteome with Trypsin, Chymotrypsin, Trypsin+LysC, LysN, ArgC proteases suitable for different mass spec machines.| Try ESI |
 |
|---|
| ChTry ESI |
|
|---|
| ArgC ESI |
|
|---|
| LysN ESI |
|
|---|
| TryLysC ESI |
|
|---|
| Try MALDI |
|
|---|
| ChTry MALDI |
|
|---|
| ArgC MALDI |
|
|---|
| LysN MALDI |
|
|---|
| TryLysC MALDI |
|
|---|
| Try LTQ |
|
|---|
| ChTry LTQ |
|
|---|
| ArgC LTQ |
|
|---|
| LysN LTQ |
|
|---|
| TryLysC LTQ |
|
|---|
| Try MSlow |
|
|---|
| ChTry MSlow |
|
|---|
| ArgC MSlow |
|
|---|
| LysN MSlow |
|
|---|
| TryLysC MSlow |
|
|---|
| Try MShigh |
|
|---|
| ChTry MShigh |
|
|---|
| ArgC MShigh |
|
|---|
| LysN MShigh |
|
|---|
| TryLysC MShigh |
|
|---|
General Statistics
Number of major isoforms |
Number of additional isoforms |
Number of all proteins |
Number of amino acids |
Min. Seq. Length |
Max. Seq. Length |
Avg. Seq. Length |
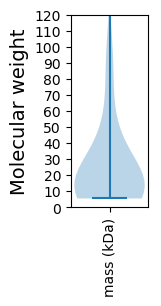
Avg. Mol. Weight |
|---|---|---|---|---|---|---|---|
0 |
22154 |
46 |
3450 |
243.5 |
27.11 |
Amino acid frequency
Ala |
Cys |
Asp |
Glu |
Phe |
Gly |
His |
Ile |
Lys |
Leu |
|---|---|---|---|---|---|---|---|---|---|
8.703 ± 0.621 | 0.849 ± 0.135 |
5.696 ± 0.149 | 6.631 ± 0.286 |
3.756 ± 0.199 | 6.653 ± 0.228 |
1.711 ± 0.156 | 5.733 ± 0.257 |
6.405 ± 0.296 | 8.319 ± 0.223 |
Met |
Asn |
Gln |
Pro |
Arg |
Ser |
Thr |
Val |
Trp |
Tyr |
|---|---|---|---|---|---|---|---|---|---|
2.966 ± 0.122 | 5.651 ± 0.166 |
4.067 ± 0.169 | 4.297 ± 0.358 |
4.311 ± 0.164 | 6.256 ± 0.224 |
6.378 ± 0.28 | 6.748 ± 0.236 |
1.196 ± 0.115 | 3.674 ± 0.261 |
Most of the basic statistics you can see at this page can be downloaded from this CSV file
See this proteome in:

Proteome-pI is available under Creative Commons Attribution-NoDerivs license, for more details see here
| Reference: Kozlowski LP. Proteome-pI 2.0: Proteome Isoelectric Point Database Update. Nucleic Acids Res. 2021, doi: 10.1093/nar/gkab944 | Contact: Lukasz P. Kozlowski |