bacterium HR23
Taxonomy: cellular organisms; Bacteria; unclassified Bacteria
Average proteome isoelectric point is 7.31
Get precalculated fractions of proteins
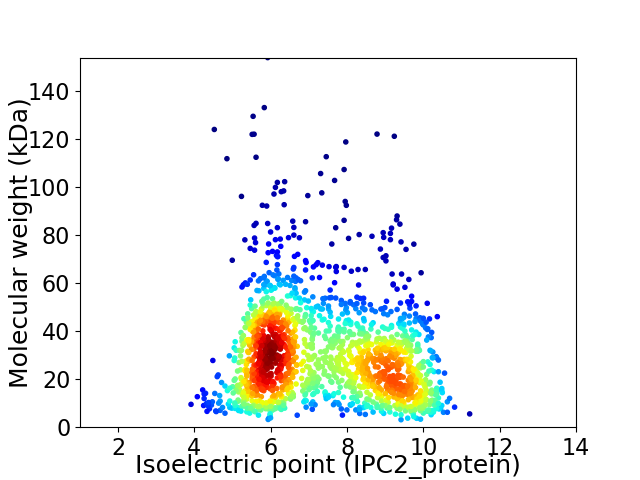
Virtual 2D-PAGE plot for 1642 proteins (isoelectric point calculated using IPC2_protein)
Get csv file with sequences according to given criteria:
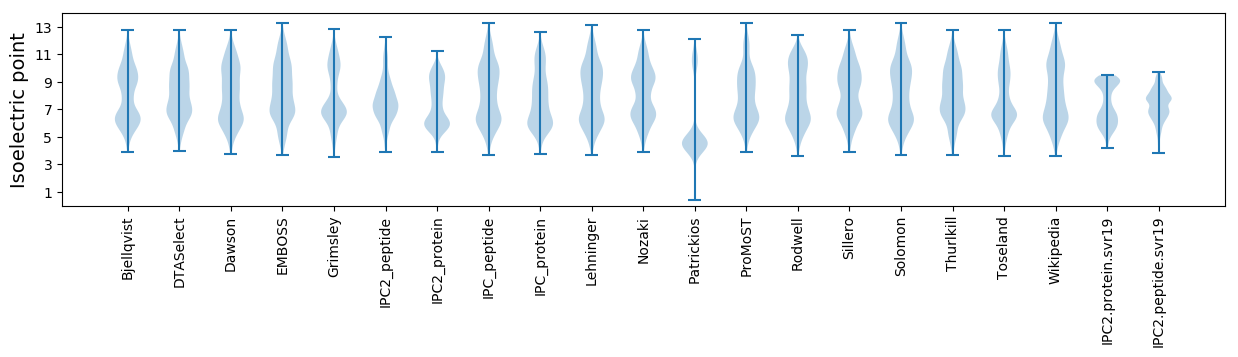
* You can choose from 21 different methods for calculating isoelectric point
Summary statistics related to proteome-wise predictions
Protein with the lowest isoelectric point:
>tr|A0A2H5YF25|A0A2H5YF25_9BACT Glucose 1-dehydrogenase OS=bacterium HR23 OX=2035418 GN=HRbin23_01662 PE=4 SV=1
MM1 pKa = 8.01PEE3 pKa = 3.3QTAQQKK9 pKa = 9.84PRR11 pKa = 11.84VTTEE15 pKa = 3.57QVIEE19 pKa = 4.14ALRR22 pKa = 11.84EE23 pKa = 4.08VYY25 pKa = 10.54DD26 pKa = 3.67PEE28 pKa = 5.14IPVNIYY34 pKa = 10.89DD35 pKa = 4.15LGLVYY40 pKa = 10.49DD41 pKa = 4.25VQVDD45 pKa = 3.77DD46 pKa = 4.05NNRR49 pKa = 11.84VYY51 pKa = 11.25VAMTLTFPGCGMGPYY66 pKa = 9.58IAQQAEE72 pKa = 3.73WRR74 pKa = 11.84IAEE77 pKa = 4.05IEE79 pKa = 4.19GVEE82 pKa = 4.15DD83 pKa = 3.68VQVEE87 pKa = 4.32LVWDD91 pKa = 4.5PPWTPDD97 pKa = 3.29MIRR100 pKa = 11.84PEE102 pKa = 4.27GKK104 pKa = 9.92KK105 pKa = 10.59LLGLEE110 pKa = 4.31EE111 pKa = 4.14
MM1 pKa = 8.01PEE3 pKa = 3.3QTAQQKK9 pKa = 9.84PRR11 pKa = 11.84VTTEE15 pKa = 3.57QVIEE19 pKa = 4.14ALRR22 pKa = 11.84EE23 pKa = 4.08VYY25 pKa = 10.54DD26 pKa = 3.67PEE28 pKa = 5.14IPVNIYY34 pKa = 10.89DD35 pKa = 4.15LGLVYY40 pKa = 10.49DD41 pKa = 4.25VQVDD45 pKa = 3.77DD46 pKa = 4.05NNRR49 pKa = 11.84VYY51 pKa = 11.25VAMTLTFPGCGMGPYY66 pKa = 9.58IAQQAEE72 pKa = 3.73WRR74 pKa = 11.84IAEE77 pKa = 4.05IEE79 pKa = 4.19GVEE82 pKa = 4.15DD83 pKa = 3.68VQVEE87 pKa = 4.32LVWDD91 pKa = 4.5PPWTPDD97 pKa = 3.29MIRR100 pKa = 11.84PEE102 pKa = 4.27GKK104 pKa = 9.92KK105 pKa = 10.59LLGLEE110 pKa = 4.31EE111 pKa = 4.14
Molecular weight: 12.69 kDa
Isoelectric point according different methods:
Protein with the highest isoelectric point:
>tr|A0A2H5YDH7|A0A2H5YDH7_9BACT Hypoxanthine phosphoribosyltransferase OS=bacterium HR23 OX=2035418 GN=hpt_2 PE=3 SV=1
MM1 pKa = 8.03PKK3 pKa = 8.97RR4 pKa = 11.84TYY6 pKa = 8.89QPKK9 pKa = 8.51RR10 pKa = 11.84RR11 pKa = 11.84RR12 pKa = 11.84RR13 pKa = 11.84QRR15 pKa = 11.84VHH17 pKa = 6.43GFLARR22 pKa = 11.84MATRR26 pKa = 11.84GGRR29 pKa = 11.84KK30 pKa = 7.38VLKK33 pKa = 9.95RR34 pKa = 11.84RR35 pKa = 11.84RR36 pKa = 11.84LAGRR40 pKa = 11.84WRR42 pKa = 11.84LAVV45 pKa = 3.41
MM1 pKa = 8.03PKK3 pKa = 8.97RR4 pKa = 11.84TYY6 pKa = 8.89QPKK9 pKa = 8.51RR10 pKa = 11.84RR11 pKa = 11.84RR12 pKa = 11.84RR13 pKa = 11.84QRR15 pKa = 11.84VHH17 pKa = 6.43GFLARR22 pKa = 11.84MATRR26 pKa = 11.84GGRR29 pKa = 11.84KK30 pKa = 7.38VLKK33 pKa = 9.95RR34 pKa = 11.84RR35 pKa = 11.84RR36 pKa = 11.84LAGRR40 pKa = 11.84WRR42 pKa = 11.84LAVV45 pKa = 3.41
Molecular weight: 5.53 kDa
Isoelectric point according different methods:
Peptides (in silico digests for buttom-up proteomics)
Below you can find in silico digests of the whole proteome with Trypsin, Chymotrypsin, Trypsin+LysC, LysN, ArgC proteases suitable for different mass spec machines.| Try ESI |
 |
|---|
| ChTry ESI |
|
|---|
| ArgC ESI |
|
|---|
| LysN ESI |
|
|---|
| TryLysC ESI |
|
|---|
| Try MALDI |
|
|---|
| ChTry MALDI |
|
|---|
| ArgC MALDI |
|
|---|
| LysN MALDI |
|
|---|
| TryLysC MALDI |
|
|---|
| Try LTQ |
|
|---|
| ChTry LTQ |
|
|---|
| ArgC LTQ |
|
|---|
| LysN LTQ |
|
|---|
| TryLysC LTQ |
|
|---|
| Try MSlow |
|
|---|
| ChTry MSlow |
|
|---|
| ArgC MSlow |
|
|---|
| LysN MSlow |
|
|---|
| TryLysC MSlow |
|
|---|
| Try MShigh |
|
|---|
| ChTry MShigh |
|
|---|
| ArgC MShigh |
|
|---|
| LysN MShigh |
|
|---|
| TryLysC MShigh |
|
|---|
General Statistics
Number of major isoforms |
Number of additional isoforms |
Number of all proteins |
Number of amino acids |
Min. Seq. Length |
Max. Seq. Length |
Avg. Seq. Length |
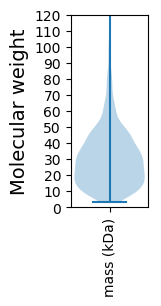
Avg. Mol. Weight |
|---|---|---|---|---|---|---|---|
0 |
473262 |
29 |
1371 |
288.2 |
31.62 |
Amino acid frequency
Ala |
Cys |
Asp |
Glu |
Phe |
Gly |
His |
Ile |
Lys |
Leu |
|---|---|---|---|---|---|---|---|---|---|
10.613 ± 0.063 | 1.006 ± 0.023 |
4.099 ± 0.036 | 6.226 ± 0.053 |
3.322 ± 0.036 | 9.002 ± 0.057 |
2.28 ± 0.031 | 4.175 ± 0.041 |
2.595 ± 0.041 | 11.594 ± 0.088 |
Met |
Asn |
Gln |
Pro |
Arg |
Ser |
Thr |
Val |
Trp |
Tyr |
|---|---|---|---|---|---|---|---|---|---|
1.987 ± 0.023 | 1.887 ± 0.026 |
6.725 ± 0.061 | 3.905 ± 0.043 |
8.387 ± 0.055 | 4.296 ± 0.038 |
5.039 ± 0.052 | 8.731 ± 0.06 |
1.614 ± 0.029 | 2.517 ± 0.037 |
Most of the basic statistics you can see at this page can be downloaded from this CSV file
See this proteome in:

Proteome-pI is available under Creative Commons Attribution-NoDerivs license, for more details see here
| Reference: Kozlowski LP. Proteome-pI 2.0: Proteome Isoelectric Point Database Update. Nucleic Acids Res. 2021, doi: 10.1093/nar/gkab944 | Contact: Lukasz P. Kozlowski |