Catonella morbi ATCC 51271
Taxonomy: cellular organisms; Bacteria; Terrabacteria group; Firmicutes; Clostridia; Eubacteriales; Lachnospiraceae; Catonella; Catonella morbi
Average proteome isoelectric point is 6.43
Get precalculated fractions of proteins
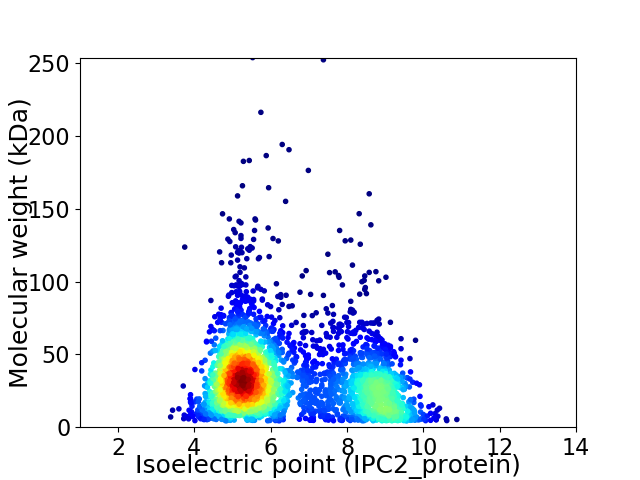
Virtual 2D-PAGE plot for 3288 proteins (isoelectric point calculated using IPC2_protein)
Get csv file with sequences according to given criteria:
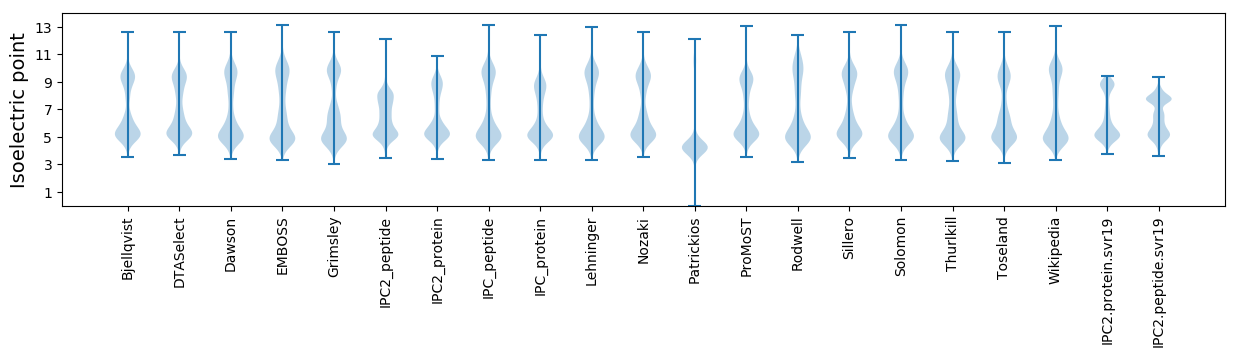
* You can choose from 21 different methods for calculating isoelectric point
Summary statistics related to proteome-wise predictions
Protein with the lowest isoelectric point:
>tr|V2Y2B9|V2Y2B9_9FIRM Putative transposase OS=Catonella morbi ATCC 51271 OX=592026 GN=GCWU0000282_002336 PE=4 SV=1
MM1 pKa = 7.45SEE3 pKa = 3.74QRR5 pKa = 11.84ITKK8 pKa = 10.36DD9 pKa = 3.18MIIADD14 pKa = 4.5IIQIDD19 pKa = 4.07EE20 pKa = 4.12NLIPVLLNAGMHH32 pKa = 6.09CVGCPSSMGEE42 pKa = 4.15TLEE45 pKa = 4.21EE46 pKa = 3.85AAEE49 pKa = 4.09VHH51 pKa = 7.15GIDD54 pKa = 5.3ADD56 pKa = 4.14EE57 pKa = 5.12LCDD60 pKa = 4.81LLNEE64 pKa = 5.37FIDD67 pKa = 3.72
MM1 pKa = 7.45SEE3 pKa = 3.74QRR5 pKa = 11.84ITKK8 pKa = 10.36DD9 pKa = 3.18MIIADD14 pKa = 4.5IIQIDD19 pKa = 4.07EE20 pKa = 4.12NLIPVLLNAGMHH32 pKa = 6.09CVGCPSSMGEE42 pKa = 4.15TLEE45 pKa = 4.21EE46 pKa = 3.85AAEE49 pKa = 4.09VHH51 pKa = 7.15GIDD54 pKa = 5.3ADD56 pKa = 4.14EE57 pKa = 5.12LCDD60 pKa = 4.81LLNEE64 pKa = 5.37FIDD67 pKa = 3.72
Molecular weight: 7.34 kDa
Isoelectric point according different methods:
Protein with the highest isoelectric point:
>tr|V2Y387|V2Y387_9FIRM Uncharacterized protein OS=Catonella morbi ATCC 51271 OX=592026 GN=GCWU0000282_002663 PE=4 SV=1
MM1 pKa = 7.67KK2 pKa = 8.72MTFQPKK8 pKa = 8.95KK9 pKa = 7.58RR10 pKa = 11.84QRR12 pKa = 11.84SKK14 pKa = 9.07VHH16 pKa = 6.0GFRR19 pKa = 11.84KK20 pKa = 9.75RR21 pKa = 11.84MKK23 pKa = 8.33TADD26 pKa = 3.28GRR28 pKa = 11.84RR29 pKa = 11.84VLARR33 pKa = 11.84RR34 pKa = 11.84RR35 pKa = 11.84AKK37 pKa = 10.17GRR39 pKa = 11.84KK40 pKa = 8.79KK41 pKa = 10.63LSAA44 pKa = 3.95
MM1 pKa = 7.67KK2 pKa = 8.72MTFQPKK8 pKa = 8.95KK9 pKa = 7.58RR10 pKa = 11.84QRR12 pKa = 11.84SKK14 pKa = 9.07VHH16 pKa = 6.0GFRR19 pKa = 11.84KK20 pKa = 9.75RR21 pKa = 11.84MKK23 pKa = 8.33TADD26 pKa = 3.28GRR28 pKa = 11.84RR29 pKa = 11.84VLARR33 pKa = 11.84RR34 pKa = 11.84RR35 pKa = 11.84AKK37 pKa = 10.17GRR39 pKa = 11.84KK40 pKa = 8.79KK41 pKa = 10.63LSAA44 pKa = 3.95
Molecular weight: 5.28 kDa
Isoelectric point according different methods:
Peptides (in silico digests for buttom-up proteomics)
Below you can find in silico digests of the whole proteome with Trypsin, Chymotrypsin, Trypsin+LysC, LysN, ArgC proteases suitable for different mass spec machines.| Try ESI |
 |
|---|
| ChTry ESI |
|
|---|
| ArgC ESI |
|
|---|
| LysN ESI |
|
|---|
| TryLysC ESI |
|
|---|
| Try MALDI |
|
|---|
| ChTry MALDI |
|
|---|
| ArgC MALDI |
|
|---|
| LysN MALDI |
|
|---|
| TryLysC MALDI |
|
|---|
| Try LTQ |
|
|---|
| ChTry LTQ |
|
|---|
| ArgC LTQ |
|
|---|
| LysN LTQ |
|
|---|
| TryLysC LTQ |
|
|---|
| Try MSlow |
|
|---|
| ChTry MSlow |
|
|---|
| ArgC MSlow |
|
|---|
| LysN MSlow |
|
|---|
| TryLysC MSlow |
|
|---|
| Try MShigh |
|
|---|
| ChTry MShigh |
|
|---|
| ArgC MShigh |
|
|---|
| LysN MShigh |
|
|---|
| TryLysC MShigh |
|
|---|
General Statistics
Number of major isoforms |
Number of additional isoforms |
Number of all proteins |
Number of amino acids |
Min. Seq. Length |
Max. Seq. Length |
Avg. Seq. Length |
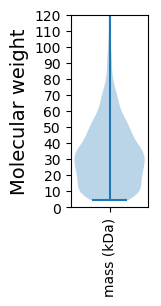
Avg. Mol. Weight |
|---|---|---|---|---|---|---|---|
0 |
1036118 |
37 |
2273 |
315.1 |
35.48 |
Amino acid frequency
Ala |
Cys |
Asp |
Glu |
Phe |
Gly |
His |
Ile |
Lys |
Leu |
|---|---|---|---|---|---|---|---|---|---|
6.72 ± 0.046 | 1.153 ± 0.018 |
5.653 ± 0.035 | 7.788 ± 0.047 |
4.508 ± 0.036 | 6.819 ± 0.044 |
1.389 ± 0.017 | 8.3 ± 0.04 |
8.585 ± 0.044 | 8.886 ± 0.044 |
Met |
Asn |
Gln |
Pro |
Arg |
Ser |
Thr |
Val |
Trp |
Tyr |
|---|---|---|---|---|---|---|---|---|---|
2.824 ± 0.023 | 5.271 ± 0.033 |
2.931 ± 0.02 | 2.252 ± 0.02 |
3.889 ± 0.031 | 6.134 ± 0.03 |
5.219 ± 0.038 | 6.636 ± 0.039 |
0.822 ± 0.014 | 4.222 ± 0.027 |
Most of the basic statistics you can see at this page can be downloaded from this CSV file
See this proteome in:

Proteome-pI is available under Creative Commons Attribution-NoDerivs license, for more details see here
| Reference: Kozlowski LP. Proteome-pI 2.0: Proteome Isoelectric Point Database Update. Nucleic Acids Res. 2021, doi: 10.1093/nar/gkab944 | Contact: Lukasz P. Kozlowski |