Pseudomonas phage vB_PaeP_C2-10_Ab22
Taxonomy: Viruses; Duplodnaviria; Heunggongvirae; Uroviricota; Caudoviricetes; Caudovirales; Podoviridae; Bruynoghevirus; Pseudomonas virus Ab22
Average proteome isoelectric point is 6.4
Get precalculated fractions of proteins
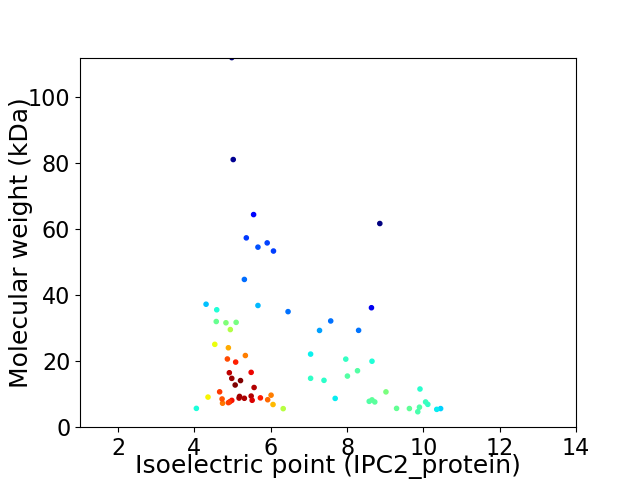
Virtual 2D-PAGE plot for 71 proteins (isoelectric point calculated using IPC2_protein)
Get csv file with sequences according to given criteria:
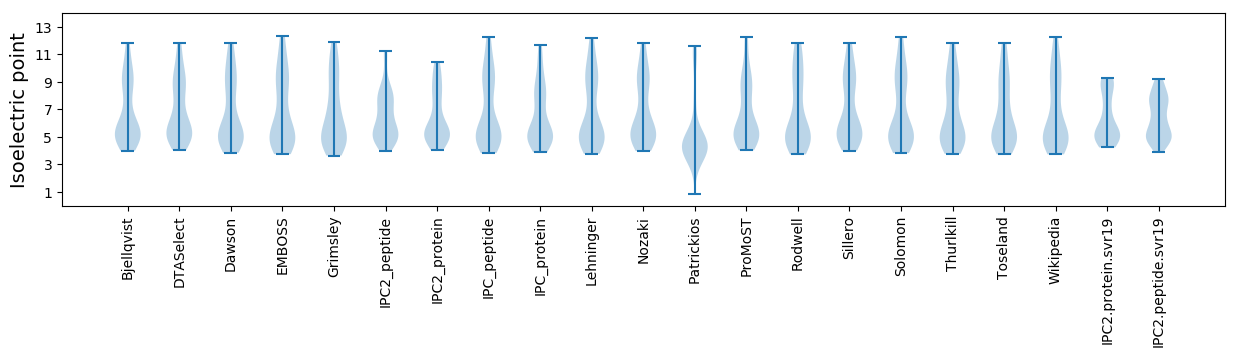
* You can choose from 21 different methods for calculating isoelectric point
Summary statistics related to proteome-wise predictions
Protein with the lowest isoelectric point:
>tr|A0A0A1IWR0|A0A0A1IWR0_9CAUD Uncharacterized protein OS=Pseudomonas phage vB_PaeP_C2-10_Ab22 OX=1548906 GN=ORF39 PE=4 SV=1
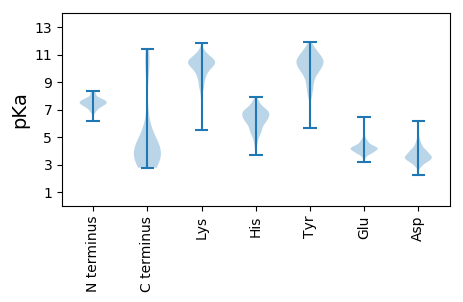
MM1 pKa = 7.09TSKK4 pKa = 10.76KK5 pKa = 10.32EE6 pKa = 4.04SLEE9 pKa = 3.95EE10 pKa = 3.74QALKK14 pKa = 10.64EE15 pKa = 3.78IALEE19 pKa = 4.34KK20 pKa = 10.35EE21 pKa = 4.86FSGSWGGPEE30 pKa = 4.13IDD32 pKa = 5.3ADD34 pKa = 4.14DD35 pKa = 4.73FPLGSACGLDD45 pKa = 3.54PEE47 pKa = 4.85VCEE50 pKa = 4.52SCQQ53 pKa = 3.52
MM1 pKa = 7.09TSKK4 pKa = 10.76KK5 pKa = 10.32EE6 pKa = 4.04SLEE9 pKa = 3.95EE10 pKa = 3.74QALKK14 pKa = 10.64EE15 pKa = 3.78IALEE19 pKa = 4.34KK20 pKa = 10.35EE21 pKa = 4.86FSGSWGGPEE30 pKa = 4.13IDD32 pKa = 5.3ADD34 pKa = 4.14DD35 pKa = 4.73FPLGSACGLDD45 pKa = 3.54PEE47 pKa = 4.85VCEE50 pKa = 4.52SCQQ53 pKa = 3.52
Molecular weight: 5.71 kDa
Isoelectric point according different methods:
Protein with the highest isoelectric point:
>tr|A0A0A1IUQ0|A0A0A1IUQ0_9CAUD Uncharacterized protein OS=Pseudomonas phage vB_PaeP_C2-10_Ab22 OX=1548906 GN=ORF23 PE=4 SV=1
MM1 pKa = 7.7GKK3 pKa = 9.85RR4 pKa = 11.84KK5 pKa = 9.69VFYY8 pKa = 10.55EE9 pKa = 4.02RR10 pKa = 11.84LCSNGEE16 pKa = 3.75LTLNGNLKK24 pKa = 8.43ATKK27 pKa = 10.24VSAPTKK33 pKa = 10.02GKK35 pKa = 6.62QQRR38 pKa = 11.84RR39 pKa = 11.84GAFF42 pKa = 3.15
MM1 pKa = 7.7GKK3 pKa = 9.85RR4 pKa = 11.84KK5 pKa = 9.69VFYY8 pKa = 10.55EE9 pKa = 4.02RR10 pKa = 11.84LCSNGEE16 pKa = 3.75LTLNGNLKK24 pKa = 8.43ATKK27 pKa = 10.24VSAPTKK33 pKa = 10.02GKK35 pKa = 6.62QQRR38 pKa = 11.84RR39 pKa = 11.84GAFF42 pKa = 3.15
Molecular weight: 4.68 kDa
Isoelectric point according different methods:
Peptides (in silico digests for buttom-up proteomics)
Below you can find in silico digests of the whole proteome with Trypsin, Chymotrypsin, Trypsin+LysC, LysN, ArgC proteases suitable for different mass spec machines.| Try ESI |
 |
|---|
| ChTry ESI |
|
|---|
| ArgC ESI |
|
|---|
| LysN ESI |
|
|---|
| TryLysC ESI |
|
|---|
| Try MALDI |
|
|---|
| ChTry MALDI |
|
|---|
| ArgC MALDI |
|
|---|
| LysN MALDI |
|
|---|
| TryLysC MALDI |
|
|---|
| Try LTQ |
|
|---|
| ChTry LTQ |
|
|---|
| ArgC LTQ |
|
|---|
| LysN LTQ |
|
|---|
| TryLysC LTQ |
|
|---|
| Try MSlow |
|
|---|
| ChTry MSlow |
|
|---|
| ArgC MSlow |
|
|---|
| LysN MSlow |
|
|---|
| TryLysC MSlow |
|
|---|
| Try MShigh |
|
|---|
| ChTry MShigh |
|
|---|
| ArgC MShigh |
|
|---|
| LysN MShigh |
|
|---|
| TryLysC MShigh |
|
|---|
General Statistics
Number of major isoforms |
Number of additional isoforms |
Number of all proteins |
Number of amino acids |
Min. Seq. Length |
Max. Seq. Length |
Avg. Seq. Length |
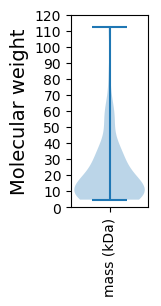
Avg. Mol. Weight |
|---|---|---|---|---|---|---|---|
0 |
13934 |
42 |
1055 |
196.3 |
21.92 |
Amino acid frequency
Ala |
Cys |
Asp |
Glu |
Phe |
Gly |
His |
Ile |
Lys |
Leu |
|---|---|---|---|---|---|---|---|---|---|
8.418 ± 0.609 | 1.012 ± 0.159 |
5.914 ± 0.25 | 7.191 ± 0.429 |
3.854 ± 0.212 | 8.246 ± 0.359 |
1.974 ± 0.212 | 5.174 ± 0.201 |
5.813 ± 0.286 | 8.153 ± 0.286 |
Met |
Asn |
Gln |
Pro |
Arg |
Ser |
Thr |
Val |
Trp |
Tyr |
|---|---|---|---|---|---|---|---|---|---|
2.727 ± 0.184 | 4.356 ± 0.218 |
4.263 ± 0.239 | 4.127 ± 0.277 |
5.957 ± 0.345 | 5.792 ± 0.273 |
5.167 ± 0.293 | 6.954 ± 0.227 |
1.701 ± 0.139 | 3.208 ± 0.187 |
Most of the basic statistics you can see at this page can be downloaded from this CSV file
See this proteome in:

Proteome-pI is available under Creative Commons Attribution-NoDerivs license, for more details see here
| Reference: Kozlowski LP. Proteome-pI 2.0: Proteome Isoelectric Point Database Update. Nucleic Acids Res. 2021, doi: 10.1093/nar/gkab944 | Contact: Lukasz P. Kozlowski |