Betaproteobacteria bacterium UKL13-2
Taxonomy: cellular organisms; Bacteria; Proteobacteria; Betaproteobacteria; unclassified Betaproteobacteria
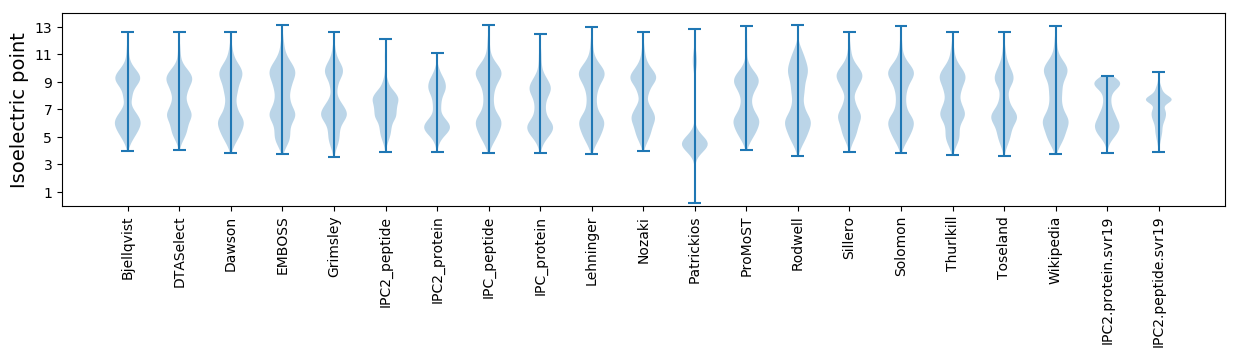
Average proteome isoelectric point is 7.02
Get precalculated fractions of proteins
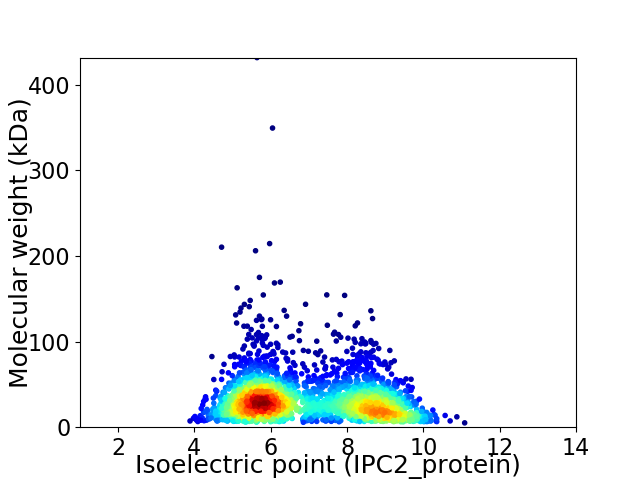
Virtual 2D-PAGE plot for 2745 proteins (isoelectric point calculated using IPC2_protein)
Get csv file with sequences according to given criteria:
* You can choose from 21 different methods for calculating isoelectric point
Summary statistics related to proteome-wise predictions
Protein with the lowest isoelectric point:
>tr|A0A142LH60|A0A142LH60_9PROT Methylase OS=Betaproteobacteria bacterium UKL13-2 OX=1690485 GN=AEM42_02510 PE=4 SV=1
MM1 pKa = 6.11TTAAATKK8 pKa = 8.51TWMCLVCGWIYY19 pKa = 11.2NEE21 pKa = 3.91IEE23 pKa = 3.89GWPEE27 pKa = 3.56DD28 pKa = 4.31GIAPGTAWADD38 pKa = 3.57VPVGWACPEE47 pKa = 3.88CGARR51 pKa = 11.84KK52 pKa = 9.51EE53 pKa = 3.97DD54 pKa = 3.81FEE56 pKa = 4.37MVEE59 pKa = 4.0II60 pKa = 4.86
MM1 pKa = 6.11TTAAATKK8 pKa = 8.51TWMCLVCGWIYY19 pKa = 11.2NEE21 pKa = 3.91IEE23 pKa = 3.89GWPEE27 pKa = 3.56DD28 pKa = 4.31GIAPGTAWADD38 pKa = 3.57VPVGWACPEE47 pKa = 3.88CGARR51 pKa = 11.84KK52 pKa = 9.51EE53 pKa = 3.97DD54 pKa = 3.81FEE56 pKa = 4.37MVEE59 pKa = 4.0II60 pKa = 4.86
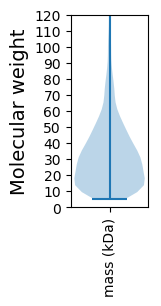
Molecular weight: 6.61 kDa
Isoelectric point according different methods:
Protein with the highest isoelectric point:
>tr|A0A142LGU4|A0A142LGU4_9PROT Uncharacterized protein OS=Betaproteobacteria bacterium UKL13-2 OX=1690485 GN=AEM42_01745 PE=4 SV=1
MM1 pKa = 7.35KK2 pKa = 9.36RR3 pKa = 11.84TYY5 pKa = 9.86QPSVARR11 pKa = 11.84RR12 pKa = 11.84KK13 pKa = 8.08KK14 pKa = 7.52THH16 pKa = 5.12GFRR19 pKa = 11.84VRR21 pKa = 11.84MQTAGGRR28 pKa = 11.84KK29 pKa = 8.95VINARR34 pKa = 11.84RR35 pKa = 11.84AKK37 pKa = 10.07GRR39 pKa = 11.84ARR41 pKa = 11.84LAVV44 pKa = 3.42
MM1 pKa = 7.35KK2 pKa = 9.36RR3 pKa = 11.84TYY5 pKa = 9.86QPSVARR11 pKa = 11.84RR12 pKa = 11.84KK13 pKa = 8.08KK14 pKa = 7.52THH16 pKa = 5.12GFRR19 pKa = 11.84VRR21 pKa = 11.84MQTAGGRR28 pKa = 11.84KK29 pKa = 8.95VINARR34 pKa = 11.84RR35 pKa = 11.84AKK37 pKa = 10.07GRR39 pKa = 11.84ARR41 pKa = 11.84LAVV44 pKa = 3.42
Molecular weight: 5.07 kDa
Isoelectric point according different methods:
Peptides (in silico digests for buttom-up proteomics)
Below you can find in silico digests of the whole proteome with Trypsin, Chymotrypsin, Trypsin+LysC, LysN, ArgC proteases suitable for different mass spec machines.| Try ESI |
 |
|---|
| ChTry ESI |
|
|---|
| ArgC ESI |
|
|---|
| LysN ESI |
|
|---|
| TryLysC ESI |
|
|---|
| Try MALDI |
|
|---|
| ChTry MALDI |
|
|---|
| ArgC MALDI |
|
|---|
| LysN MALDI |
|
|---|
| TryLysC MALDI |
|
|---|
| Try LTQ |
|
|---|
| ChTry LTQ |
|
|---|
| ArgC LTQ |
|
|---|
| LysN LTQ |
|
|---|
| TryLysC LTQ |
|
|---|
| Try MSlow |
|
|---|
| ChTry MSlow |
|
|---|
| ArgC MSlow |
|
|---|
| LysN MSlow |
|
|---|
| TryLysC MSlow |
|
|---|
| Try MShigh |
|
|---|
| ChTry MShigh |
|
|---|
| ArgC MShigh |
|
|---|
| LysN MShigh |
|
|---|
| TryLysC MShigh |
|
|---|
General Statistics
Number of major isoforms |
Number of additional isoforms |
Number of all proteins |
Number of amino acids |
Min. Seq. Length |
Max. Seq. Length |
Avg. Seq. Length |
Avg. Mol. Weight |
|---|---|---|---|---|---|---|---|
0 |
861845 |
44 |
4192 |
314.0 |
34.29 |
Amino acid frequency
Ala |
Cys |
Asp |
Glu |
Phe |
Gly |
His |
Ile |
Lys |
Leu |
|---|---|---|---|---|---|---|---|---|---|
11.446 ± 0.052 | 0.935 ± 0.017 |
5.31 ± 0.038 | 5.284 ± 0.048 |
3.917 ± 0.031 | 7.672 ± 0.05 |
2.096 ± 0.027 | 5.507 ± 0.037 |
4.486 ± 0.044 | 9.732 ± 0.057 |
Met |
Asn |
Gln |
Pro |
Arg |
Ser |
Thr |
Val |
Trp |
Tyr |
|---|---|---|---|---|---|---|---|---|---|
2.581 ± 0.026 | 3.379 ± 0.035 |
4.758 ± 0.028 | 3.555 ± 0.027 |
6.135 ± 0.05 | 5.938 ± 0.043 |
5.905 ± 0.09 | 7.586 ± 0.041 |
1.303 ± 0.02 | 2.474 ± 0.022 |
Most of the basic statistics you can see at this page can be downloaded from this CSV file
See this proteome in:

Proteome-pI is available under Creative Commons Attribution-NoDerivs license, for more details see here
| Reference: Kozlowski LP. Proteome-pI 2.0: Proteome Isoelectric Point Database Update. Nucleic Acids Res. 2021, doi: 10.1093/nar/gkab944 | Contact: Lukasz P. Kozlowski |