Rhodanobacter sp. C06
Taxonomy: cellular organisms; Bacteria; Proteobacteria; Gammaproteobacteria; Xanthomonadales; Rhodanobacteraceae; Rhodanobacter; unclassified Rhodanobacter
Average proteome isoelectric point is 6.81
Get precalculated fractions of proteins
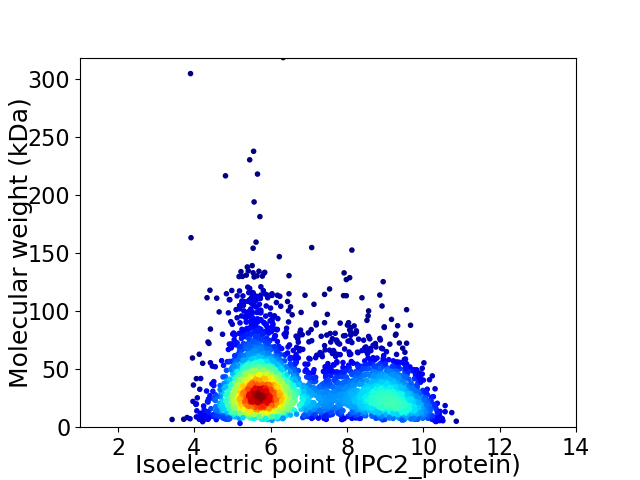
Virtual 2D-PAGE plot for 3484 proteins (isoelectric point calculated using IPC2_protein)
Get csv file with sequences according to given criteria:
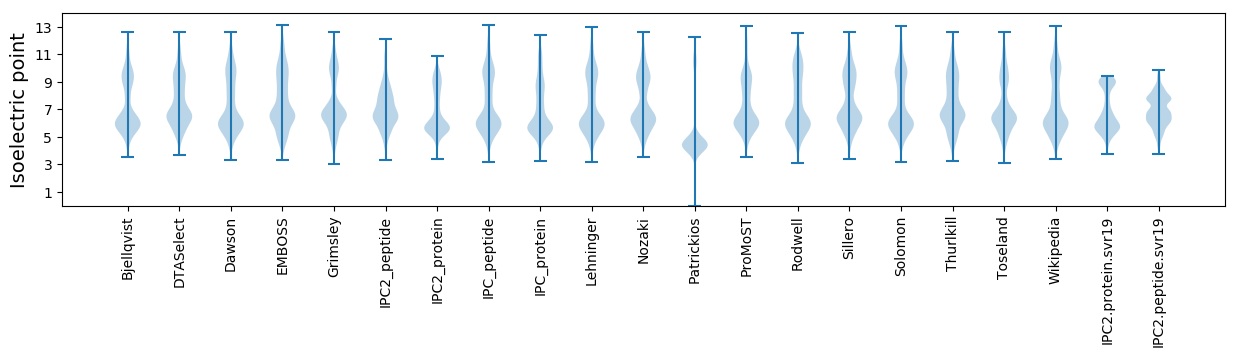
* You can choose from 21 different methods for calculating isoelectric point
Summary statistics related to proteome-wise predictions
Protein with the lowest isoelectric point:
>tr|A0A1V3NWH5|A0A1V3NWH5_9GAMM Glyco_trans_2-like domain-containing protein OS=Rhodanobacter sp. C06 OX=1945854 GN=B0E52_16850 PE=4 SV=1
MM1 pKa = 7.07SQSSTEE7 pKa = 4.0TATLRR12 pKa = 11.84KK13 pKa = 8.32WMCVVCGYY21 pKa = 10.36IYY23 pKa = 10.73DD24 pKa = 3.93EE25 pKa = 4.39ALGVPEE31 pKa = 4.48EE32 pKa = 5.27DD33 pKa = 3.11IAAGTRR39 pKa = 11.84WEE41 pKa = 4.75DD42 pKa = 3.72VPEE45 pKa = 4.08TWTCPDD51 pKa = 3.54CGATKK56 pKa = 10.56SDD58 pKa = 3.53FEE60 pKa = 4.55MIEE63 pKa = 3.67VDD65 pKa = 3.41
MM1 pKa = 7.07SQSSTEE7 pKa = 4.0TATLRR12 pKa = 11.84KK13 pKa = 8.32WMCVVCGYY21 pKa = 10.36IYY23 pKa = 10.73DD24 pKa = 3.93EE25 pKa = 4.39ALGVPEE31 pKa = 4.48EE32 pKa = 5.27DD33 pKa = 3.11IAAGTRR39 pKa = 11.84WEE41 pKa = 4.75DD42 pKa = 3.72VPEE45 pKa = 4.08TWTCPDD51 pKa = 3.54CGATKK56 pKa = 10.56SDD58 pKa = 3.53FEE60 pKa = 4.55MIEE63 pKa = 3.67VDD65 pKa = 3.41
Molecular weight: 7.27 kDa
Isoelectric point according different methods:
Protein with the highest isoelectric point:
>tr|A0A1V3PHA9|A0A1V3PHA9_9GAMM Amino acid permease OS=Rhodanobacter sp. C06 OX=1945854 GN=B0E52_03675 PE=4 SV=1
MM1 pKa = 7.45KK2 pKa = 9.59RR3 pKa = 11.84TFQPSKK9 pKa = 10.06LKK11 pKa = 10.38RR12 pKa = 11.84ARR14 pKa = 11.84THH16 pKa = 5.89GFRR19 pKa = 11.84ARR21 pKa = 11.84MATADD26 pKa = 3.2GRR28 pKa = 11.84KK29 pKa = 9.07ILNARR34 pKa = 11.84RR35 pKa = 11.84AKK37 pKa = 9.77GRR39 pKa = 11.84KK40 pKa = 8.92RR41 pKa = 11.84LIPP44 pKa = 4.02
MM1 pKa = 7.45KK2 pKa = 9.59RR3 pKa = 11.84TFQPSKK9 pKa = 10.06LKK11 pKa = 10.38RR12 pKa = 11.84ARR14 pKa = 11.84THH16 pKa = 5.89GFRR19 pKa = 11.84ARR21 pKa = 11.84MATADD26 pKa = 3.2GRR28 pKa = 11.84KK29 pKa = 9.07ILNARR34 pKa = 11.84RR35 pKa = 11.84AKK37 pKa = 9.77GRR39 pKa = 11.84KK40 pKa = 8.92RR41 pKa = 11.84LIPP44 pKa = 4.02
Molecular weight: 5.15 kDa
Isoelectric point according different methods:
Peptides (in silico digests for buttom-up proteomics)
Below you can find in silico digests of the whole proteome with Trypsin, Chymotrypsin, Trypsin+LysC, LysN, ArgC proteases suitable for different mass spec machines.| Try ESI |
 |
|---|
| ChTry ESI |
|
|---|
| ArgC ESI |
|
|---|
| LysN ESI |
|
|---|
| TryLysC ESI |
|
|---|
| Try MALDI |
|
|---|
| ChTry MALDI |
|
|---|
| ArgC MALDI |
|
|---|
| LysN MALDI |
|
|---|
| TryLysC MALDI |
|
|---|
| Try LTQ |
|
|---|
| ChTry LTQ |
|
|---|
| ArgC LTQ |
|
|---|
| LysN LTQ |
|
|---|
| TryLysC LTQ |
|
|---|
| Try MSlow |
|
|---|
| ChTry MSlow |
|
|---|
| ArgC MSlow |
|
|---|
| LysN MSlow |
|
|---|
| TryLysC MSlow |
|
|---|
| Try MShigh |
|
|---|
| ChTry MShigh |
|
|---|
| ArgC MShigh |
|
|---|
| LysN MShigh |
|
|---|
| TryLysC MShigh |
|
|---|
General Statistics
Number of major isoforms |
Number of additional isoforms |
Number of all proteins |
Number of amino acids |
Min. Seq. Length |
Max. Seq. Length |
Avg. Seq. Length |
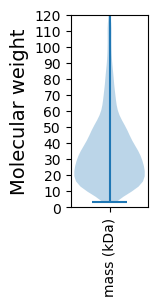
Avg. Mol. Weight |
|---|---|---|---|---|---|---|---|
0 |
1183550 |
30 |
3271 |
339.7 |
36.85 |
Amino acid frequency
Ala |
Cys |
Asp |
Glu |
Phe |
Gly |
His |
Ile |
Lys |
Leu |
|---|---|---|---|---|---|---|---|---|---|
13.4 ± 0.062 | 0.884 ± 0.013 |
5.66 ± 0.035 | 4.871 ± 0.045 |
3.331 ± 0.025 | 8.608 ± 0.051 |
2.598 ± 0.022 | 3.988 ± 0.03 |
2.85 ± 0.035 | 11.187 ± 0.052 |
Met |
Asn |
Gln |
Pro |
Arg |
Ser |
Thr |
Val |
Trp |
Tyr |
|---|---|---|---|---|---|---|---|---|---|
2.178 ± 0.018 | 2.564 ± 0.035 |
5.44 ± 0.033 | 3.833 ± 0.027 |
7.213 ± 0.054 | 4.984 ± 0.039 |
4.916 ± 0.041 | 7.361 ± 0.038 |
1.631 ± 0.022 | 2.504 ± 0.029 |
Most of the basic statistics you can see at this page can be downloaded from this CSV file
See this proteome in:

Proteome-pI is available under Creative Commons Attribution-NoDerivs license, for more details see here
| Reference: Kozlowski LP. Proteome-pI 2.0: Proteome Isoelectric Point Database Update. Nucleic Acids Res. 2021, doi: 10.1093/nar/gkab944 | Contact: Lukasz P. Kozlowski |