Rubrobacter radiotolerans
Taxonomy: cellular organisms; Bacteria; Terrabacteria group; Actinobacteria; Rubrobacteria; Rubrobacterales; Rubrobacteraceae; Rubrobacter
Average proteome isoelectric point is 6.14
Get precalculated fractions of proteins
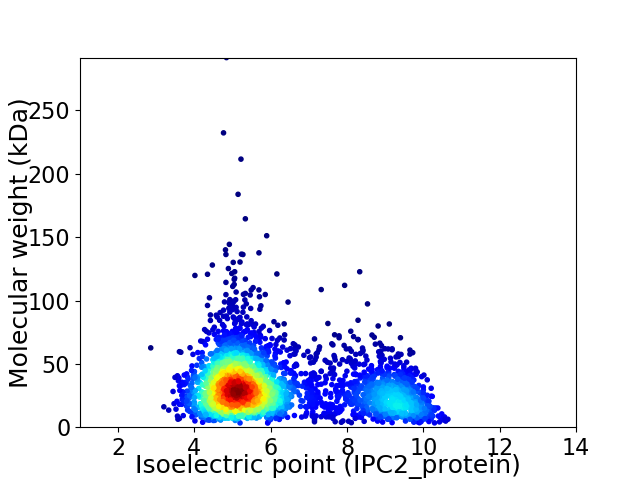
Virtual 2D-PAGE plot for 3148 proteins (isoelectric point calculated using IPC2_protein)
Get csv file with sequences according to given criteria:
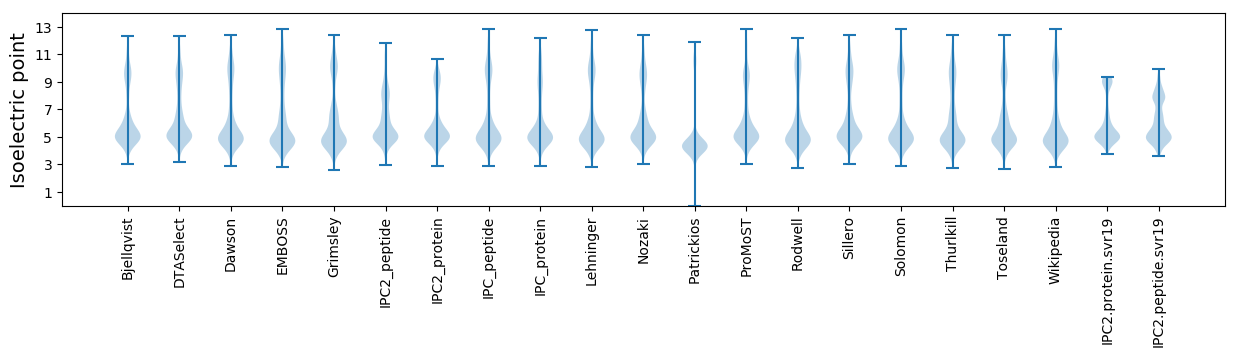
* You can choose from 21 different methods for calculating isoelectric point
Summary statistics related to proteome-wise predictions
Protein with the lowest isoelectric point:
>tr|A0A023X6K6|A0A023X6K6_9ACTN Beta-lactamase class A OS=Rubrobacter radiotolerans OX=42256 GN=RradSPS_2347 PE=4 SV=1
MM1 pKa = 7.17IAAIAMLAFVGGCGSLVQGGGQEE24 pKa = 4.04QQGGSGQQQEE34 pKa = 4.4QQQGQQGGEE43 pKa = 3.84DD44 pKa = 3.58TQQQEE49 pKa = 4.21QQASGGEE56 pKa = 4.31TTQEE60 pKa = 3.94QQGGEE65 pKa = 4.08QGAQAPEE72 pKa = 4.53DD73 pKa = 3.86PTLSLSIPSLNKK85 pKa = 10.23NIEE88 pKa = 4.45NIPTGRR94 pKa = 11.84GDD96 pKa = 4.93DD97 pKa = 3.92EE98 pKa = 5.37QLLTDD103 pKa = 3.79NAAIHH108 pKa = 5.67VFPTGFPWQEE118 pKa = 3.64GANTYY123 pKa = 10.34LAGHH127 pKa = 5.63VEE129 pKa = 5.4GYY131 pKa = 9.86PGTPSYY137 pKa = 11.06KK138 pKa = 10.09AFEE141 pKa = 4.38GLRR144 pKa = 11.84EE145 pKa = 4.05LQNGDD150 pKa = 4.03EE151 pKa = 5.13IIITDD156 pKa = 3.83ANGTEE161 pKa = 3.93YY162 pKa = 10.2TYY164 pKa = 11.13EE165 pKa = 3.98VFEE168 pKa = 4.68GRR170 pKa = 11.84VIDD173 pKa = 3.91PTDD176 pKa = 3.39TSVLDD181 pKa = 3.83PVPGRR186 pKa = 11.84SIVTLQTCEE195 pKa = 3.88IVEE198 pKa = 4.27VNPDD202 pKa = 3.33GTPNYY207 pKa = 10.18SDD209 pKa = 3.33TEE211 pKa = 4.13RR212 pKa = 11.84YY213 pKa = 8.76IVQGEE218 pKa = 4.29LVSS221 pKa = 3.66
MM1 pKa = 7.17IAAIAMLAFVGGCGSLVQGGGQEE24 pKa = 4.04QQGGSGQQQEE34 pKa = 4.4QQQGQQGGEE43 pKa = 3.84DD44 pKa = 3.58TQQQEE49 pKa = 4.21QQASGGEE56 pKa = 4.31TTQEE60 pKa = 3.94QQGGEE65 pKa = 4.08QGAQAPEE72 pKa = 4.53DD73 pKa = 3.86PTLSLSIPSLNKK85 pKa = 10.23NIEE88 pKa = 4.45NIPTGRR94 pKa = 11.84GDD96 pKa = 4.93DD97 pKa = 3.92EE98 pKa = 5.37QLLTDD103 pKa = 3.79NAAIHH108 pKa = 5.67VFPTGFPWQEE118 pKa = 3.64GANTYY123 pKa = 10.34LAGHH127 pKa = 5.63VEE129 pKa = 5.4GYY131 pKa = 9.86PGTPSYY137 pKa = 11.06KK138 pKa = 10.09AFEE141 pKa = 4.38GLRR144 pKa = 11.84EE145 pKa = 4.05LQNGDD150 pKa = 4.03EE151 pKa = 5.13IIITDD156 pKa = 3.83ANGTEE161 pKa = 3.93YY162 pKa = 10.2TYY164 pKa = 11.13EE165 pKa = 3.98VFEE168 pKa = 4.68GRR170 pKa = 11.84VIDD173 pKa = 3.91PTDD176 pKa = 3.39TSVLDD181 pKa = 3.83PVPGRR186 pKa = 11.84SIVTLQTCEE195 pKa = 3.88IVEE198 pKa = 4.27VNPDD202 pKa = 3.33GTPNYY207 pKa = 10.18SDD209 pKa = 3.33TEE211 pKa = 4.13RR212 pKa = 11.84YY213 pKa = 8.76IVQGEE218 pKa = 4.29LVSS221 pKa = 3.66
Molecular weight: 23.53 kDa
Isoelectric point according different methods:
Protein with the highest isoelectric point:
>tr|A0A023X753|A0A023X753_9ACTN Probable glycine dehydrogenase (decarboxylating) subunit 1 OS=Rubrobacter radiotolerans OX=42256 GN=gcvPA PE=3 SV=1
MM1 pKa = 7.6SEE3 pKa = 3.94RR4 pKa = 11.84SNEE7 pKa = 3.96RR8 pKa = 11.84GGGRR12 pKa = 11.84LAGALARR19 pKa = 11.84KK20 pKa = 9.36SGRR23 pKa = 11.84AVAGSATGTGDD34 pKa = 4.06LAPVRR39 pKa = 11.84AASRR43 pKa = 11.84PGVAGGGVRR52 pKa = 11.84SRR54 pKa = 11.84RR55 pKa = 11.84RR56 pKa = 11.84TSGPSRR62 pKa = 11.84TRR64 pKa = 11.84SADD67 pKa = 3.26YY68 pKa = 9.04KK69 pKa = 10.72QCMAHH74 pKa = 5.89IRR76 pKa = 11.84KK77 pKa = 9.36DD78 pKa = 3.11VRR80 pKa = 11.84EE81 pKa = 4.05RR82 pKa = 11.84VEE84 pKa = 3.88EE85 pKa = 3.9ARR87 pKa = 11.84HH88 pKa = 4.76NRR90 pKa = 11.84EE91 pKa = 3.21VRR93 pKa = 11.84AVLEE97 pKa = 4.08EE98 pKa = 4.11DD99 pKa = 3.37LRR101 pKa = 11.84AAGILFKK108 pKa = 10.56PGNPEE113 pKa = 3.35YY114 pKa = 10.65SALVEE119 pKa = 4.03LLLVQWLEE127 pKa = 4.04NVGFGPEE134 pKa = 3.9DD135 pKa = 3.13
MM1 pKa = 7.6SEE3 pKa = 3.94RR4 pKa = 11.84SNEE7 pKa = 3.96RR8 pKa = 11.84GGGRR12 pKa = 11.84LAGALARR19 pKa = 11.84KK20 pKa = 9.36SGRR23 pKa = 11.84AVAGSATGTGDD34 pKa = 4.06LAPVRR39 pKa = 11.84AASRR43 pKa = 11.84PGVAGGGVRR52 pKa = 11.84SRR54 pKa = 11.84RR55 pKa = 11.84RR56 pKa = 11.84TSGPSRR62 pKa = 11.84TRR64 pKa = 11.84SADD67 pKa = 3.26YY68 pKa = 9.04KK69 pKa = 10.72QCMAHH74 pKa = 5.89IRR76 pKa = 11.84KK77 pKa = 9.36DD78 pKa = 3.11VRR80 pKa = 11.84EE81 pKa = 4.05RR82 pKa = 11.84VEE84 pKa = 3.88EE85 pKa = 3.9ARR87 pKa = 11.84HH88 pKa = 4.76NRR90 pKa = 11.84EE91 pKa = 3.21VRR93 pKa = 11.84AVLEE97 pKa = 4.08EE98 pKa = 4.11DD99 pKa = 3.37LRR101 pKa = 11.84AAGILFKK108 pKa = 10.56PGNPEE113 pKa = 3.35YY114 pKa = 10.65SALVEE119 pKa = 4.03LLLVQWLEE127 pKa = 4.04NVGFGPEE134 pKa = 3.9DD135 pKa = 3.13
Molecular weight: 14.54 kDa
Isoelectric point according different methods:
Peptides (in silico digests for buttom-up proteomics)
Below you can find in silico digests of the whole proteome with Trypsin, Chymotrypsin, Trypsin+LysC, LysN, ArgC proteases suitable for different mass spec machines.| Try ESI |
 |
|---|
| ChTry ESI |
|
|---|
| ArgC ESI |
|
|---|
| LysN ESI |
|
|---|
| TryLysC ESI |
|
|---|
| Try MALDI |
|
|---|
| ChTry MALDI |
|
|---|
| ArgC MALDI |
|
|---|
| LysN MALDI |
|
|---|
| TryLysC MALDI |
|
|---|
| Try LTQ |
|
|---|
| ChTry LTQ |
|
|---|
| ArgC LTQ |
|
|---|
| LysN LTQ |
|
|---|
| TryLysC LTQ |
|
|---|
| Try MSlow |
|
|---|
| ChTry MSlow |
|
|---|
| ArgC MSlow |
|
|---|
| LysN MSlow |
|
|---|
| TryLysC MSlow |
|
|---|
| Try MShigh |
|
|---|
| ChTry MShigh |
|
|---|
| ArgC MShigh |
|
|---|
| LysN MShigh |
|
|---|
| TryLysC MShigh |
|
|---|
General Statistics
Number of major isoforms |
Number of additional isoforms |
Number of all proteins |
Number of amino acids |
Min. Seq. Length |
Max. Seq. Length |
Avg. Seq. Length |
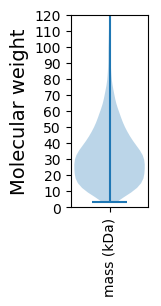
Avg. Mol. Weight |
|---|---|---|---|---|---|---|---|
0 |
976227 |
30 |
2566 |
310.1 |
33.69 |
Amino acid frequency
Ala |
Cys |
Asp |
Glu |
Phe |
Gly |
His |
Ile |
Lys |
Leu |
|---|---|---|---|---|---|---|---|---|---|
11.135 ± 0.059 | 0.71 ± 0.012 |
5.162 ± 0.033 | 8.312 ± 0.053 |
3.631 ± 0.027 | 9.739 ± 0.043 |
1.672 ± 0.019 | 3.777 ± 0.034 |
2.656 ± 0.031 | 10.441 ± 0.054 |
Met |
Asn |
Gln |
Pro |
Arg |
Ser |
Thr |
Val |
Trp |
Tyr |
|---|---|---|---|---|---|---|---|---|---|
1.912 ± 0.019 | 2.206 ± 0.021 |
5.141 ± 0.032 | 2.198 ± 0.03 |
8.26 ± 0.051 | 5.769 ± 0.03 |
4.91 ± 0.024 | 8.739 ± 0.04 |
1.12 ± 0.017 | 2.507 ± 0.022 |
Most of the basic statistics you can see at this page can be downloaded from this CSV file
See this proteome in:

Proteome-pI is available under Creative Commons Attribution-NoDerivs license, for more details see here
| Reference: Kozlowski LP. Proteome-pI 2.0: Proteome Isoelectric Point Database Update. Nucleic Acids Res. 2021, doi: 10.1093/nar/gkab944 | Contact: Lukasz P. Kozlowski |