Tindallia californiensis
Taxonomy: cellular organisms; Bacteria; Terrabacteria group; Firmicutes; Clostridia; Eubacteriales; Clostridiaceae; Tindallia
Average proteome isoelectric point is 6.24
Get precalculated fractions of proteins
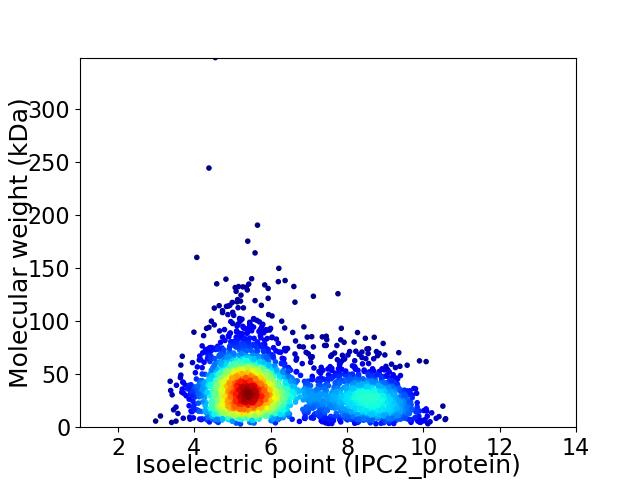
Virtual 2D-PAGE plot for 2832 proteins (isoelectric point calculated using IPC2_protein)
Get csv file with sequences according to given criteria:
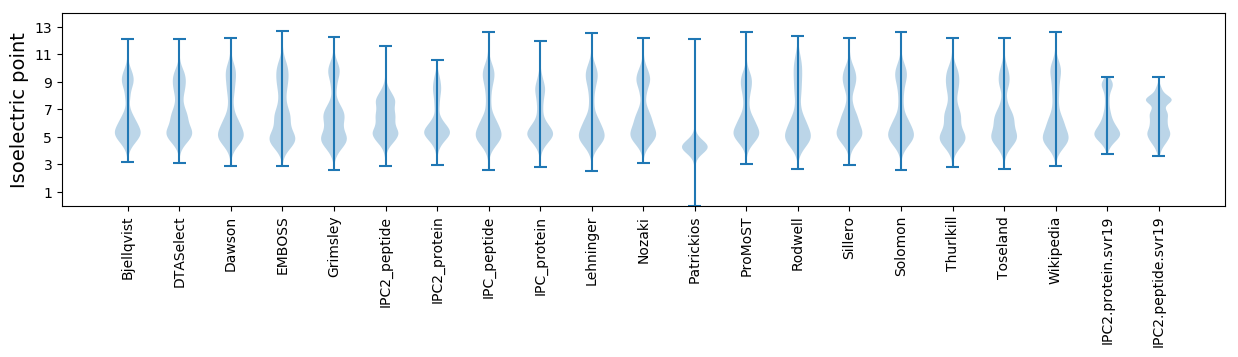
* You can choose from 21 different methods for calculating isoelectric point
Summary statistics related to proteome-wise predictions
Protein with the lowest isoelectric point:
>tr|A0A1H3I875|A0A1H3I875_9CLOT Pyrimidine-specific ribonucleoside hydrolase OS=Tindallia californiensis OX=159292 GN=SAMN05192546_10145 PE=4 SV=1
MM1 pKa = 8.12RR2 pKa = 11.84KK3 pKa = 9.5RR4 pKa = 11.84KK5 pKa = 9.63NLFCMLLVVLLVFSLLAGCGSPAEE29 pKa = 4.04EE30 pKa = 4.28DD31 pKa = 3.31AVEE34 pKa = 4.18EE35 pKa = 4.21VSEE38 pKa = 4.18EE39 pKa = 4.47TITEE43 pKa = 4.0PSEE46 pKa = 4.15EE47 pKa = 3.95EE48 pKa = 4.15VVITVAAGAVGQEE61 pKa = 4.29LEE63 pKa = 4.35LTQLAAEE70 pKa = 5.06MYY72 pKa = 10.0MDD74 pKa = 5.79DD75 pKa = 4.18NPNVIVNVLDD85 pKa = 4.14TPDD88 pKa = 3.64LAQDD92 pKa = 3.47RR93 pKa = 11.84LGLYY97 pKa = 10.05LQFFEE102 pKa = 4.52AQSAEE107 pKa = 3.73VDD109 pKa = 3.17IYY111 pKa = 10.94QIDD114 pKa = 4.47VIWPGDD120 pKa = 3.8LEE122 pKa = 4.25EE123 pKa = 5.31HH124 pKa = 6.49FVDD127 pKa = 5.06LYY129 pKa = 11.18EE130 pKa = 4.42YY131 pKa = 10.88GADD134 pKa = 3.38AVVEE138 pKa = 4.15DD139 pKa = 4.75HH140 pKa = 7.13FPAIVEE146 pKa = 4.2NNTVNGRR153 pKa = 11.84LVAIPWFTDD162 pKa = 2.64AGLLYY167 pKa = 10.83YY168 pKa = 9.89RR169 pKa = 11.84TDD171 pKa = 3.53LLEE174 pKa = 5.54KK175 pKa = 10.72YY176 pKa = 10.36DD177 pKa = 4.05FAPPEE182 pKa = 3.92TWEE185 pKa = 4.12EE186 pKa = 3.97LVEE189 pKa = 4.0QAQTIQQGEE198 pKa = 4.16RR199 pKa = 11.84DD200 pKa = 3.9EE201 pKa = 5.15GNQDD205 pKa = 2.94FVGYY209 pKa = 9.37VWQGDD214 pKa = 3.81AYY216 pKa = 10.46EE217 pKa = 4.82GLTCNALEE225 pKa = 4.8WIASNNGGTIISPEE239 pKa = 3.88GVITVNNEE247 pKa = 3.13NAAEE251 pKa = 4.47IIDD254 pKa = 4.16MAATWVGTISPEE266 pKa = 4.11GVTGMAEE273 pKa = 3.67EE274 pKa = 4.45DD275 pKa = 4.81ARR277 pKa = 11.84AIWQGGNAAFMRR289 pKa = 11.84NWPYY293 pKa = 11.12AYY295 pKa = 10.66SLGQEE300 pKa = 4.35DD301 pKa = 4.54DD302 pKa = 4.07SAVKK306 pKa = 10.52DD307 pKa = 3.64IFDD310 pKa = 4.22VSPLPAGTNGEE321 pKa = 4.12PAATLGGWQLAVSKK335 pKa = 10.86YY336 pKa = 10.79SEE338 pKa = 4.42NPDD341 pKa = 3.11VAADD345 pKa = 3.56VALFMASYY353 pKa = 11.38DD354 pKa = 3.85MQKK357 pKa = 9.32MRR359 pKa = 11.84AVDD362 pKa = 3.9GSLNPTIMDD371 pKa = 4.47LYY373 pKa = 10.39EE374 pKa = 6.19DD375 pKa = 4.26EE376 pKa = 5.71DD377 pKa = 4.03VLEE380 pKa = 4.45AAPFFGSLYY389 pKa = 10.61DD390 pKa = 3.52VFINAVARR398 pKa = 11.84PSTASAPNYY407 pKa = 9.41NAVSTAFFRR416 pKa = 11.84AVHH419 pKa = 5.82NVLNGNTDD427 pKa = 2.96AATALEE433 pKa = 4.19EE434 pKa = 5.27LEE436 pKa = 5.98LDD438 pKa = 3.88LQDD441 pKa = 3.04ITGFDD446 pKa = 3.41IEE448 pKa = 4.35
MM1 pKa = 8.12RR2 pKa = 11.84KK3 pKa = 9.5RR4 pKa = 11.84KK5 pKa = 9.63NLFCMLLVVLLVFSLLAGCGSPAEE29 pKa = 4.04EE30 pKa = 4.28DD31 pKa = 3.31AVEE34 pKa = 4.18EE35 pKa = 4.21VSEE38 pKa = 4.18EE39 pKa = 4.47TITEE43 pKa = 4.0PSEE46 pKa = 4.15EE47 pKa = 3.95EE48 pKa = 4.15VVITVAAGAVGQEE61 pKa = 4.29LEE63 pKa = 4.35LTQLAAEE70 pKa = 5.06MYY72 pKa = 10.0MDD74 pKa = 5.79DD75 pKa = 4.18NPNVIVNVLDD85 pKa = 4.14TPDD88 pKa = 3.64LAQDD92 pKa = 3.47RR93 pKa = 11.84LGLYY97 pKa = 10.05LQFFEE102 pKa = 4.52AQSAEE107 pKa = 3.73VDD109 pKa = 3.17IYY111 pKa = 10.94QIDD114 pKa = 4.47VIWPGDD120 pKa = 3.8LEE122 pKa = 4.25EE123 pKa = 5.31HH124 pKa = 6.49FVDD127 pKa = 5.06LYY129 pKa = 11.18EE130 pKa = 4.42YY131 pKa = 10.88GADD134 pKa = 3.38AVVEE138 pKa = 4.15DD139 pKa = 4.75HH140 pKa = 7.13FPAIVEE146 pKa = 4.2NNTVNGRR153 pKa = 11.84LVAIPWFTDD162 pKa = 2.64AGLLYY167 pKa = 10.83YY168 pKa = 9.89RR169 pKa = 11.84TDD171 pKa = 3.53LLEE174 pKa = 5.54KK175 pKa = 10.72YY176 pKa = 10.36DD177 pKa = 4.05FAPPEE182 pKa = 3.92TWEE185 pKa = 4.12EE186 pKa = 3.97LVEE189 pKa = 4.0QAQTIQQGEE198 pKa = 4.16RR199 pKa = 11.84DD200 pKa = 3.9EE201 pKa = 5.15GNQDD205 pKa = 2.94FVGYY209 pKa = 9.37VWQGDD214 pKa = 3.81AYY216 pKa = 10.46EE217 pKa = 4.82GLTCNALEE225 pKa = 4.8WIASNNGGTIISPEE239 pKa = 3.88GVITVNNEE247 pKa = 3.13NAAEE251 pKa = 4.47IIDD254 pKa = 4.16MAATWVGTISPEE266 pKa = 4.11GVTGMAEE273 pKa = 3.67EE274 pKa = 4.45DD275 pKa = 4.81ARR277 pKa = 11.84AIWQGGNAAFMRR289 pKa = 11.84NWPYY293 pKa = 11.12AYY295 pKa = 10.66SLGQEE300 pKa = 4.35DD301 pKa = 4.54DD302 pKa = 4.07SAVKK306 pKa = 10.52DD307 pKa = 3.64IFDD310 pKa = 4.22VSPLPAGTNGEE321 pKa = 4.12PAATLGGWQLAVSKK335 pKa = 10.86YY336 pKa = 10.79SEE338 pKa = 4.42NPDD341 pKa = 3.11VAADD345 pKa = 3.56VALFMASYY353 pKa = 11.38DD354 pKa = 3.85MQKK357 pKa = 9.32MRR359 pKa = 11.84AVDD362 pKa = 3.9GSLNPTIMDD371 pKa = 4.47LYY373 pKa = 10.39EE374 pKa = 6.19DD375 pKa = 4.26EE376 pKa = 5.71DD377 pKa = 4.03VLEE380 pKa = 4.45AAPFFGSLYY389 pKa = 10.61DD390 pKa = 3.52VFINAVARR398 pKa = 11.84PSTASAPNYY407 pKa = 9.41NAVSTAFFRR416 pKa = 11.84AVHH419 pKa = 5.82NVLNGNTDD427 pKa = 2.96AATALEE433 pKa = 4.19EE434 pKa = 5.27LEE436 pKa = 5.98LDD438 pKa = 3.88LQDD441 pKa = 3.04ITGFDD446 pKa = 3.41IEE448 pKa = 4.35
Molecular weight: 49.08 kDa
Isoelectric point according different methods:
Protein with the highest isoelectric point:
>tr|A0A1H3MEV2|A0A1H3MEV2_9CLOT Predicted Fe-Mo cluster-binding protein NifX family OS=Tindallia californiensis OX=159292 GN=SAMN05192546_104110 PE=4 SV=1
MM1 pKa = 7.17YY2 pKa = 10.23NYY4 pKa = 10.26RR5 pKa = 11.84CRR7 pKa = 11.84DD8 pKa = 2.83RR9 pKa = 11.84WNGKK13 pKa = 9.0RR14 pKa = 11.84YY15 pKa = 7.78YY16 pKa = 10.38QRR18 pKa = 11.84TVKK21 pKa = 10.6KK22 pKa = 9.96IGKK25 pKa = 9.64DD26 pKa = 3.02SDD28 pKa = 3.48RR29 pKa = 11.84QGVYY33 pKa = 9.81NAGMDD38 pKa = 3.68RR39 pKa = 11.84RR40 pKa = 11.84ILSMMVIRR48 pKa = 5.67
MM1 pKa = 7.17YY2 pKa = 10.23NYY4 pKa = 10.26RR5 pKa = 11.84CRR7 pKa = 11.84DD8 pKa = 2.83RR9 pKa = 11.84WNGKK13 pKa = 9.0RR14 pKa = 11.84YY15 pKa = 7.78YY16 pKa = 10.38QRR18 pKa = 11.84TVKK21 pKa = 10.6KK22 pKa = 9.96IGKK25 pKa = 9.64DD26 pKa = 3.02SDD28 pKa = 3.48RR29 pKa = 11.84QGVYY33 pKa = 9.81NAGMDD38 pKa = 3.68RR39 pKa = 11.84RR40 pKa = 11.84ILSMMVIRR48 pKa = 5.67
Molecular weight: 5.95 kDa
Isoelectric point according different methods:
Peptides (in silico digests for buttom-up proteomics)
Below you can find in silico digests of the whole proteome with Trypsin, Chymotrypsin, Trypsin+LysC, LysN, ArgC proteases suitable for different mass spec machines.| Try ESI |
 |
|---|
| ChTry ESI |
|
|---|
| ArgC ESI |
|
|---|
| LysN ESI |
|
|---|
| TryLysC ESI |
|
|---|
| Try MALDI |
|
|---|
| ChTry MALDI |
|
|---|
| ArgC MALDI |
|
|---|
| LysN MALDI |
|
|---|
| TryLysC MALDI |
|
|---|
| Try LTQ |
|
|---|
| ChTry LTQ |
|
|---|
| ArgC LTQ |
|
|---|
| LysN LTQ |
|
|---|
| TryLysC LTQ |
|
|---|
| Try MSlow |
|
|---|
| ChTry MSlow |
|
|---|
| ArgC MSlow |
|
|---|
| LysN MSlow |
|
|---|
| TryLysC MSlow |
|
|---|
| Try MShigh |
|
|---|
| ChTry MShigh |
|
|---|
| ArgC MShigh |
|
|---|
| LysN MShigh |
|
|---|
| TryLysC MShigh |
|
|---|
General Statistics
Number of major isoforms |
Number of additional isoforms |
Number of all proteins |
Number of amino acids |
Min. Seq. Length |
Max. Seq. Length |
Avg. Seq. Length |
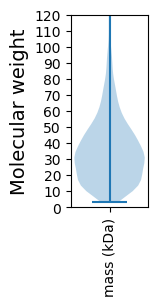
Avg. Mol. Weight |
|---|---|---|---|---|---|---|---|
0 |
931524 |
29 |
3104 |
328.9 |
36.97 |
Amino acid frequency
Ala |
Cys |
Asp |
Glu |
Phe |
Gly |
His |
Ile |
Lys |
Leu |
|---|---|---|---|---|---|---|---|---|---|
6.904 ± 0.046 | 0.928 ± 0.018 |
5.11 ± 0.036 | 8.206 ± 0.058 |
4.01 ± 0.035 | 6.906 ± 0.042 |
2.167 ± 0.022 | 7.947 ± 0.042 |
6.827 ± 0.053 | 9.564 ± 0.053 |
Met |
Asn |
Gln |
Pro |
Arg |
Ser |
Thr |
Val |
Trp |
Tyr |
|---|---|---|---|---|---|---|---|---|---|
3.306 ± 0.027 | 4.163 ± 0.033 |
3.596 ± 0.025 | 3.823 ± 0.033 |
4.407 ± 0.03 | 5.962 ± 0.035 |
5.13 ± 0.028 | 6.774 ± 0.037 |
0.888 ± 0.014 | 3.38 ± 0.027 |
Most of the basic statistics you can see at this page can be downloaded from this CSV file
See this proteome in:

Proteome-pI is available under Creative Commons Attribution-NoDerivs license, for more details see here
| Reference: Kozlowski LP. Proteome-pI 2.0: Proteome Isoelectric Point Database Update. Nucleic Acids Res. 2021, doi: 10.1093/nar/gkab944 | Contact: Lukasz P. Kozlowski |