Moraxella osloensis
Taxonomy: cellular organisms; Bacteria; Proteobacteria;
Average proteome isoelectric point is 6.51
Get precalculated fractions of proteins
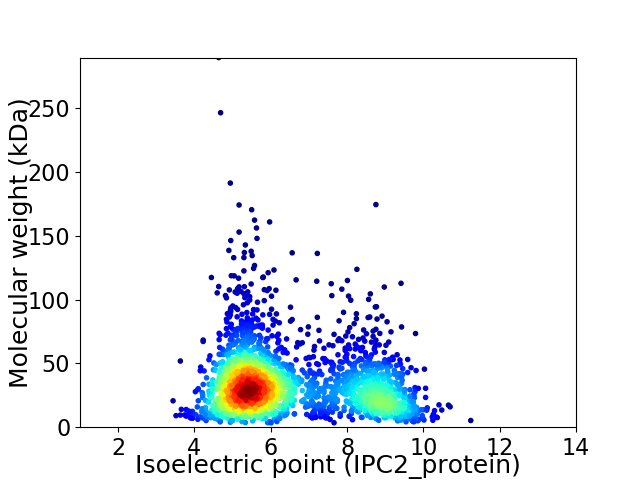
Virtual 2D-PAGE plot for 2336 proteins (isoelectric point calculated using IPC2_protein)
Get csv file with sequences according to given criteria:
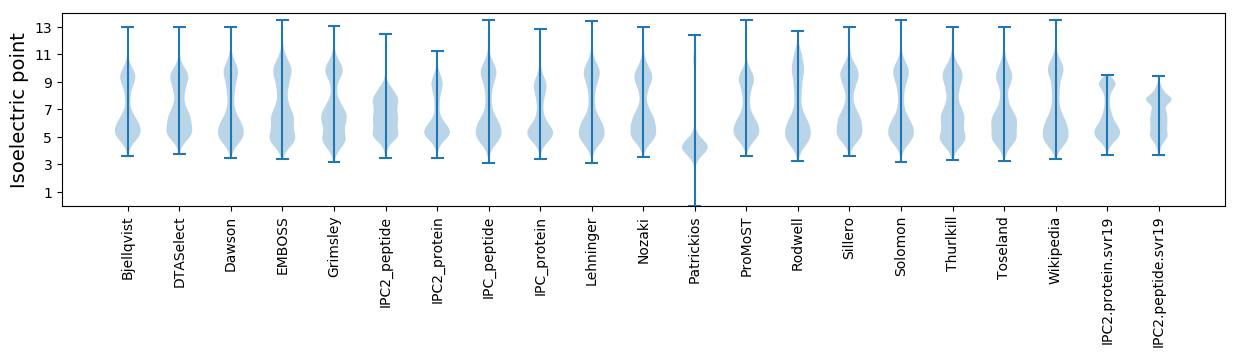
* You can choose from 21 different methods for calculating isoelectric point
Summary statistics related to proteome-wise predictions
Protein with the lowest isoelectric point:
>tr|A0A378QAS6|A0A378QAS6_MOROS dTDP-glucose 4 6-dehydratase OS=Moraxella osloensis OX=34062 GN=rfbB PE=3 SV=1
MM1 pKa = 7.83SDD3 pKa = 3.16TVTDD7 pKa = 3.69SMVDD11 pKa = 3.52GVTLTDD17 pKa = 3.33NAAKK21 pKa = 10.27KK22 pKa = 9.95VRR24 pKa = 11.84NLRR27 pKa = 11.84DD28 pKa = 3.42SEE30 pKa = 4.43GNNDD34 pKa = 3.23LMLRR38 pKa = 11.84VYY40 pKa = 9.11VTGGGCSGFSYY51 pKa = 10.54GFNFEE56 pKa = 4.7EE57 pKa = 5.09NLGDD61 pKa = 5.1DD62 pKa = 4.73DD63 pKa = 4.66ATFSNDD69 pKa = 2.94DD70 pKa = 3.18VALVVDD76 pKa = 4.19SLSYY80 pKa = 10.65QYY82 pKa = 11.78LHH84 pKa = 7.14GSTIDD89 pKa = 3.55YY90 pKa = 11.2VEE92 pKa = 4.21GLEE95 pKa = 4.38GSRR98 pKa = 11.84FTVNNPNATTTCGCGSSFSII118 pKa = 5.02
MM1 pKa = 7.83SDD3 pKa = 3.16TVTDD7 pKa = 3.69SMVDD11 pKa = 3.52GVTLTDD17 pKa = 3.33NAAKK21 pKa = 10.27KK22 pKa = 9.95VRR24 pKa = 11.84NLRR27 pKa = 11.84DD28 pKa = 3.42SEE30 pKa = 4.43GNNDD34 pKa = 3.23LMLRR38 pKa = 11.84VYY40 pKa = 9.11VTGGGCSGFSYY51 pKa = 10.54GFNFEE56 pKa = 4.7EE57 pKa = 5.09NLGDD61 pKa = 5.1DD62 pKa = 4.73DD63 pKa = 4.66ATFSNDD69 pKa = 2.94DD70 pKa = 3.18VALVVDD76 pKa = 4.19SLSYY80 pKa = 10.65QYY82 pKa = 11.78LHH84 pKa = 7.14GSTIDD89 pKa = 3.55YY90 pKa = 11.2VEE92 pKa = 4.21GLEE95 pKa = 4.38GSRR98 pKa = 11.84FTVNNPNATTTCGCGSSFSII118 pKa = 5.02
Molecular weight: 12.62 kDa
Isoelectric point according different methods:
Protein with the highest isoelectric point:
>tr|A0A0X8K713|A0A0X8K713_MOROS Homoserine kinase OS=Moraxella osloensis OX=34062 GN=thrB PE=3 SV=1
MM1 pKa = 7.45KK2 pKa = 9.51RR3 pKa = 11.84TFQPSVIKK11 pKa = 10.52RR12 pKa = 11.84KK13 pKa = 8.26RR14 pKa = 11.84THH16 pKa = 5.92GFRR19 pKa = 11.84ARR21 pKa = 11.84MATKK25 pKa = 10.4NGRR28 pKa = 11.84QVLARR33 pKa = 11.84RR34 pKa = 11.84RR35 pKa = 11.84AKK37 pKa = 10.03GRR39 pKa = 11.84HH40 pKa = 5.34RR41 pKa = 11.84LTVV44 pKa = 3.07
MM1 pKa = 7.45KK2 pKa = 9.51RR3 pKa = 11.84TFQPSVIKK11 pKa = 10.52RR12 pKa = 11.84KK13 pKa = 8.26RR14 pKa = 11.84THH16 pKa = 5.92GFRR19 pKa = 11.84ARR21 pKa = 11.84MATKK25 pKa = 10.4NGRR28 pKa = 11.84QVLARR33 pKa = 11.84RR34 pKa = 11.84RR35 pKa = 11.84AKK37 pKa = 10.03GRR39 pKa = 11.84HH40 pKa = 5.34RR41 pKa = 11.84LTVV44 pKa = 3.07
Molecular weight: 5.26 kDa
Isoelectric point according different methods:
Peptides (in silico digests for buttom-up proteomics)
Below you can find in silico digests of the whole proteome with Trypsin, Chymotrypsin, Trypsin+LysC, LysN, ArgC proteases suitable for different mass spec machines.| Try ESI |
 |
|---|
| ChTry ESI |
|
|---|
| ArgC ESI |
|
|---|
| LysN ESI |
|
|---|
| TryLysC ESI |
|
|---|
| Try MALDI |
|
|---|
| ChTry MALDI |
|
|---|
| ArgC MALDI |
|
|---|
| LysN MALDI |
|
|---|
| TryLysC MALDI |
|
|---|
| Try LTQ |
|
|---|
| ChTry LTQ |
|
|---|
| ArgC LTQ |
|
|---|
| LysN LTQ |
|
|---|
| TryLysC LTQ |
|
|---|
| Try MSlow |
|
|---|
| ChTry MSlow |
|
|---|
| ArgC MSlow |
|
|---|
| LysN MSlow |
|
|---|
| TryLysC MSlow |
|
|---|
| Try MShigh |
|
|---|
| ChTry MShigh |
|
|---|
| ArgC MShigh |
|
|---|
| LysN MShigh |
|
|---|
| TryLysC MShigh |
|
|---|
General Statistics
Number of major isoforms |
Number of additional isoforms |
Number of all proteins |
Number of amino acids |
Min. Seq. Length |
Max. Seq. Length |
Avg. Seq. Length |
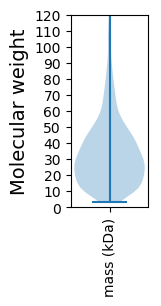
Avg. Mol. Weight |
|---|---|---|---|---|---|---|---|
0 |
750899 |
29 |
2904 |
321.4 |
35.67 |
Amino acid frequency
Ala |
Cys |
Asp |
Glu |
Phe |
Gly |
His |
Ile |
Lys |
Leu |
|---|---|---|---|---|---|---|---|---|---|
9.071 ± 0.057 | 0.886 ± 0.015 |
5.732 ± 0.041 | 5.006 ± 0.048 |
3.949 ± 0.038 | 6.4 ± 0.062 |
2.343 ± 0.028 | 6.614 ± 0.042 |
5.626 ± 0.034 | 10.134 ± 0.068 |
Met |
Asn |
Gln |
Pro |
Arg |
Ser |
Thr |
Val |
Trp |
Tyr |
|---|---|---|---|---|---|---|---|---|---|
2.617 ± 0.027 | 4.855 ± 0.048 |
4.15 ± 0.032 | 5.39 ± 0.062 |
4.209 ± 0.038 | 6.134 ± 0.034 |
6.014 ± 0.046 | 6.663 ± 0.042 |
1.156 ± 0.018 | 3.052 ± 0.031 |
Most of the basic statistics you can see at this page can be downloaded from this CSV file
See this proteome in:

Proteome-pI is available under Creative Commons Attribution-NoDerivs license, for more details see here
| Reference: Kozlowski LP. Proteome-pI 2.0: Proteome Isoelectric Point Database Update. Nucleic Acids Res. 2021, doi: 10.1093/nar/gkab944 | Contact: Lukasz P. Kozlowski |