Firmicutes bacterium CAG:345
Taxonomy: cellular organisms; Bacteria; Terrabacteria group; Firmicutes; environmental samples
Average proteome isoelectric point is 6.5
Get precalculated fractions of proteins
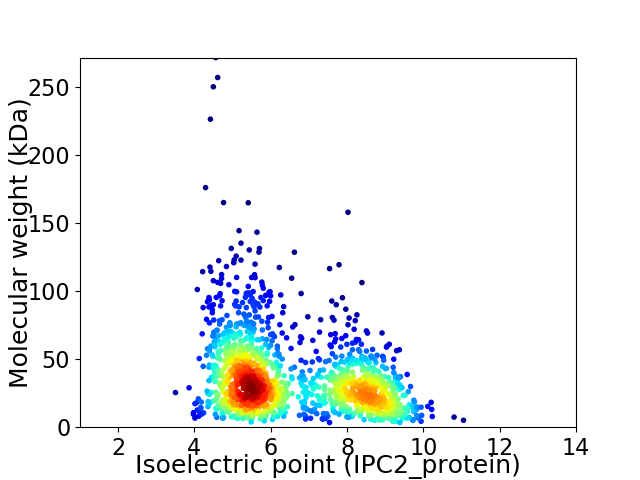
Virtual 2D-PAGE plot for 1462 proteins (isoelectric point calculated using IPC2_protein)
Get csv file with sequences according to given criteria:
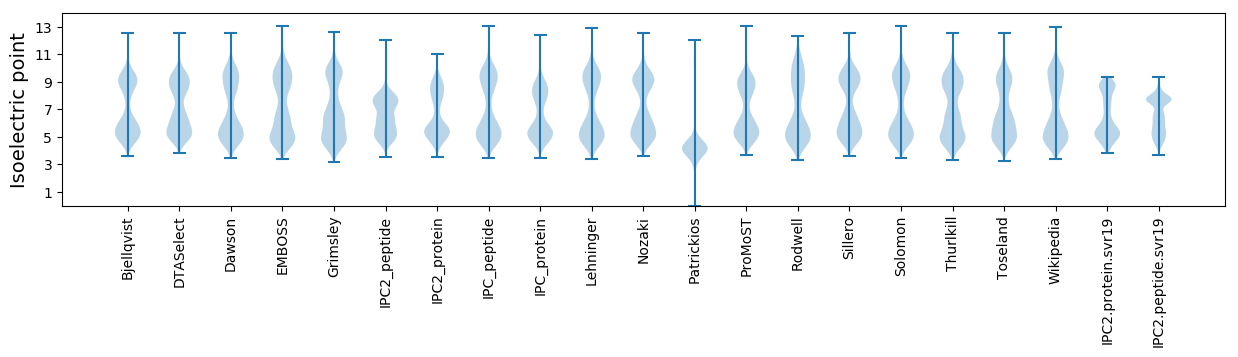
* You can choose from 21 different methods for calculating isoelectric point
Summary statistics related to proteome-wise predictions
Protein with the lowest isoelectric point:
>tr|R6YY12|R6YY12_9FIRM Uncharacterized protein OS=Firmicutes bacterium CAG:345 OX=1263020 GN=BN617_00872 PE=4 SV=1
MM1 pKa = 7.29GKK3 pKa = 9.56KK4 pKa = 8.76VHH6 pKa = 6.17VNQDD10 pKa = 3.07VCISCGMCTAICDD23 pKa = 3.63AVFAFNDD30 pKa = 3.6DD31 pKa = 3.54GKK33 pKa = 11.19ASVILDD39 pKa = 4.79EE40 pKa = 4.85IPEE43 pKa = 4.3DD44 pKa = 3.8LEE46 pKa = 5.12ASVDD50 pKa = 3.75EE51 pKa = 5.21AKK53 pKa = 10.81NSCPVQAIEE62 pKa = 4.2EE63 pKa = 4.26
MM1 pKa = 7.29GKK3 pKa = 9.56KK4 pKa = 8.76VHH6 pKa = 6.17VNQDD10 pKa = 3.07VCISCGMCTAICDD23 pKa = 3.63AVFAFNDD30 pKa = 3.6DD31 pKa = 3.54GKK33 pKa = 11.19ASVILDD39 pKa = 4.79EE40 pKa = 4.85IPEE43 pKa = 4.3DD44 pKa = 3.8LEE46 pKa = 5.12ASVDD50 pKa = 3.75EE51 pKa = 5.21AKK53 pKa = 10.81NSCPVQAIEE62 pKa = 4.2EE63 pKa = 4.26
Molecular weight: 6.72 kDa
Isoelectric point according different methods:
Protein with the highest isoelectric point:
>tr|R6XQ02|R6XQ02_9FIRM Peptide chain release factor 2 OS=Firmicutes bacterium CAG:345 OX=1263020 GN=prfB PE=3 SV=1
MM1 pKa = 7.35KK2 pKa = 9.43RR3 pKa = 11.84TYY5 pKa = 10.34QPSKK9 pKa = 10.35RR10 pKa = 11.84KK11 pKa = 8.69KK12 pKa = 8.57QSVNGFRR19 pKa = 11.84ARR21 pKa = 11.84MSTPGGRR28 pKa = 11.84KK29 pKa = 8.2VIARR33 pKa = 11.84RR34 pKa = 11.84RR35 pKa = 11.84HH36 pKa = 5.58KK37 pKa = 10.51GRR39 pKa = 11.84KK40 pKa = 8.42VLSAA44 pKa = 4.05
MM1 pKa = 7.35KK2 pKa = 9.43RR3 pKa = 11.84TYY5 pKa = 10.34QPSKK9 pKa = 10.35RR10 pKa = 11.84KK11 pKa = 8.69KK12 pKa = 8.57QSVNGFRR19 pKa = 11.84ARR21 pKa = 11.84MSTPGGRR28 pKa = 11.84KK29 pKa = 8.2VIARR33 pKa = 11.84RR34 pKa = 11.84RR35 pKa = 11.84HH36 pKa = 5.58KK37 pKa = 10.51GRR39 pKa = 11.84KK40 pKa = 8.42VLSAA44 pKa = 4.05
Molecular weight: 5.11 kDa
Isoelectric point according different methods:
Peptides (in silico digests for buttom-up proteomics)
Below you can find in silico digests of the whole proteome with Trypsin, Chymotrypsin, Trypsin+LysC, LysN, ArgC proteases suitable for different mass spec machines.| Try ESI |
 |
|---|
| ChTry ESI |
|
|---|
| ArgC ESI |
|
|---|
| LysN ESI |
|
|---|
| TryLysC ESI |
|
|---|
| Try MALDI |
|
|---|
| ChTry MALDI |
|
|---|
| ArgC MALDI |
|
|---|
| LysN MALDI |
|
|---|
| TryLysC MALDI |
|
|---|
| Try LTQ |
|
|---|
| ChTry LTQ |
|
|---|
| ArgC LTQ |
|
|---|
| LysN LTQ |
|
|---|
| TryLysC LTQ |
|
|---|
| Try MSlow |
|
|---|
| ChTry MSlow |
|
|---|
| ArgC MSlow |
|
|---|
| LysN MSlow |
|
|---|
| TryLysC MSlow |
|
|---|
| Try MShigh |
|
|---|
| ChTry MShigh |
|
|---|
| ArgC MShigh |
|
|---|
| LysN MShigh |
|
|---|
| TryLysC MShigh |
|
|---|
General Statistics
Number of major isoforms |
Number of additional isoforms |
Number of all proteins |
Number of amino acids |
Min. Seq. Length |
Max. Seq. Length |
Avg. Seq. Length |
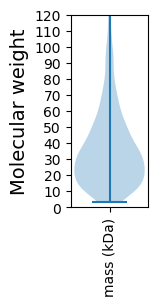
Avg. Mol. Weight |
|---|---|---|---|---|---|---|---|
0 |
491748 |
30 |
2517 |
336.4 |
38.21 |
Amino acid frequency
Ala |
Cys |
Asp |
Glu |
Phe |
Gly |
His |
Ile |
Lys |
Leu |
|---|---|---|---|---|---|---|---|---|---|
5.241 ± 0.059 | 1.188 ± 0.021 |
5.934 ± 0.053 | 6.749 ± 0.06 |
5.134 ± 0.051 | 5.633 ± 0.054 |
1.497 ± 0.024 | 9.227 ± 0.075 |
8.74 ± 0.069 | 9.29 ± 0.068 |
Met |
Asn |
Gln |
Pro |
Arg |
Ser |
Thr |
Val |
Trp |
Tyr |
|---|---|---|---|---|---|---|---|---|---|
2.11 ± 0.032 | 6.789 ± 0.074 |
2.811 ± 0.036 | 2.424 ± 0.027 |
2.958 ± 0.041 | 7.324 ± 0.072 |
5.366 ± 0.074 | 5.831 ± 0.055 |
0.623 ± 0.018 | 5.128 ± 0.06 |
Most of the basic statistics you can see at this page can be downloaded from this CSV file
See this proteome in:

Proteome-pI is available under Creative Commons Attribution-NoDerivs license, for more details see here
| Reference: Kozlowski LP. Proteome-pI 2.0: Proteome Isoelectric Point Database Update. Nucleic Acids Res. 2021, doi: 10.1093/nar/gkab944 | Contact: Lukasz P. Kozlowski |