Pseudomonas stutzeri (strain A1501)
Taxonomy: cellular organisms; Bacteria; Proteobacteria; Gammaproteobacteria; Pseudomonadales; Pseudomonadaceae; Pseudomonas; Pseudomonas stutzeri group; Pseudomonas stutzeri subgroup; Pseudomonas stutzeri
Average proteome isoelectric point is 6.42
Get precalculated fractions of proteins
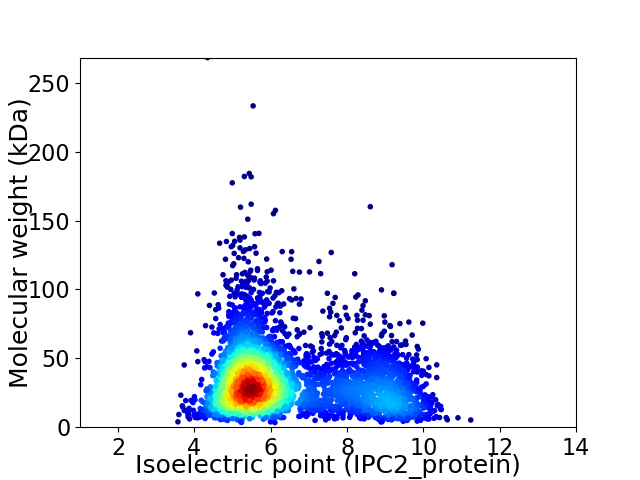
Virtual 2D-PAGE plot for 4092 proteins (isoelectric point calculated using IPC2_protein)
Get csv file with sequences according to given criteria:
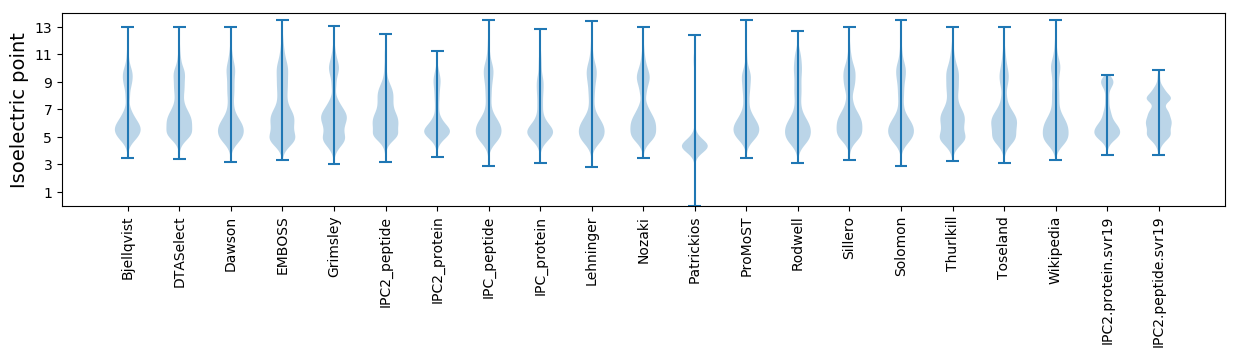
* You can choose from 21 different methods for calculating isoelectric point
Summary statistics related to proteome-wise predictions
Protein with the lowest isoelectric point:
>tr|A4VJF2|A4VJF2_PSEU5 EAL domain/GGDEF domain protein OS=Pseudomonas stutzeri (strain A1501) OX=379731 GN=PST_1412 PE=4 SV=1
MM1 pKa = 7.09TFNVALSGLNAASTDD16 pKa = 3.99LNVTGNNIANVGTTGFKK33 pKa = 10.45ASRR36 pKa = 11.84AEE38 pKa = 4.01FADD41 pKa = 4.85LYY43 pKa = 8.49ATSMLGSGGNAVGSGVTTADD63 pKa = 2.89IAQQFTQGNITNTGNSLDD81 pKa = 4.17LAISGNGYY89 pKa = 10.8FMVSNNGSMLYY100 pKa = 9.49TRR102 pKa = 11.84AGAFKK107 pKa = 9.96TDD109 pKa = 3.43DD110 pKa = 3.51EE111 pKa = 5.47GYY113 pKa = 10.01VINSEE118 pKa = 4.39GYY120 pKa = 7.83NLQGYY125 pKa = 7.67GVNANGDD132 pKa = 3.56IVSGVTTNLKK142 pKa = 10.09VDD144 pKa = 4.21SSNQAPNATSSVVEE158 pKa = 4.03TLALNSNSSVPNNTPFDD175 pKa = 4.13ASDD178 pKa = 3.05SSTYY182 pKa = 10.36NWSTSVPLYY191 pKa = 8.57DD192 pKa = 3.63TQGNSHH198 pKa = 6.49TMTQYY203 pKa = 10.42FVKK206 pKa = 10.34DD207 pKa = 4.65DD208 pKa = 3.92SNQWTMYY215 pKa = 9.77TLIDD219 pKa = 3.85GRR221 pKa = 11.84NPADD225 pKa = 3.56PTSTEE230 pKa = 3.91AYY232 pKa = 7.85EE233 pKa = 3.99VSIGFTASGALDD245 pKa = 3.87LTSLASTDD253 pKa = 3.78FDD255 pKa = 4.41VNADD259 pKa = 3.47GTLTLNTWVPATVTDD274 pKa = 4.11STTSPVTWGSNGAAASASGISIDD297 pKa = 5.08LRR299 pKa = 11.84NISQTNTSFAVLSSPVQDD317 pKa = 4.58GYY319 pKa = 8.25TTGQLSGLSIDD330 pKa = 3.85DD331 pKa = 3.69TGMMFATYY339 pKa = 10.28TNGQSKK345 pKa = 10.98VIGQVVLANFTNSQGLASVGGTAWAQTLASGEE377 pKa = 4.15PAIGTPGSGTLGSLQSGALEE397 pKa = 4.53DD398 pKa = 4.34SNVDD402 pKa = 3.41LTAQLVNLIVAQRR415 pKa = 11.84NYY417 pKa = 9.52QANAKK422 pKa = 7.98TVEE425 pKa = 4.3TEE427 pKa = 3.85SAIAQTIINLRR438 pKa = 3.68
MM1 pKa = 7.09TFNVALSGLNAASTDD16 pKa = 3.99LNVTGNNIANVGTTGFKK33 pKa = 10.45ASRR36 pKa = 11.84AEE38 pKa = 4.01FADD41 pKa = 4.85LYY43 pKa = 8.49ATSMLGSGGNAVGSGVTTADD63 pKa = 2.89IAQQFTQGNITNTGNSLDD81 pKa = 4.17LAISGNGYY89 pKa = 10.8FMVSNNGSMLYY100 pKa = 9.49TRR102 pKa = 11.84AGAFKK107 pKa = 9.96TDD109 pKa = 3.43DD110 pKa = 3.51EE111 pKa = 5.47GYY113 pKa = 10.01VINSEE118 pKa = 4.39GYY120 pKa = 7.83NLQGYY125 pKa = 7.67GVNANGDD132 pKa = 3.56IVSGVTTNLKK142 pKa = 10.09VDD144 pKa = 4.21SSNQAPNATSSVVEE158 pKa = 4.03TLALNSNSSVPNNTPFDD175 pKa = 4.13ASDD178 pKa = 3.05SSTYY182 pKa = 10.36NWSTSVPLYY191 pKa = 8.57DD192 pKa = 3.63TQGNSHH198 pKa = 6.49TMTQYY203 pKa = 10.42FVKK206 pKa = 10.34DD207 pKa = 4.65DD208 pKa = 3.92SNQWTMYY215 pKa = 9.77TLIDD219 pKa = 3.85GRR221 pKa = 11.84NPADD225 pKa = 3.56PTSTEE230 pKa = 3.91AYY232 pKa = 7.85EE233 pKa = 3.99VSIGFTASGALDD245 pKa = 3.87LTSLASTDD253 pKa = 3.78FDD255 pKa = 4.41VNADD259 pKa = 3.47GTLTLNTWVPATVTDD274 pKa = 4.11STTSPVTWGSNGAAASASGISIDD297 pKa = 5.08LRR299 pKa = 11.84NISQTNTSFAVLSSPVQDD317 pKa = 4.58GYY319 pKa = 8.25TTGQLSGLSIDD330 pKa = 3.85DD331 pKa = 3.69TGMMFATYY339 pKa = 10.28TNGQSKK345 pKa = 10.98VIGQVVLANFTNSQGLASVGGTAWAQTLASGEE377 pKa = 4.15PAIGTPGSGTLGSLQSGALEE397 pKa = 4.53DD398 pKa = 4.34SNVDD402 pKa = 3.41LTAQLVNLIVAQRR415 pKa = 11.84NYY417 pKa = 9.52QANAKK422 pKa = 7.98TVEE425 pKa = 4.3TEE427 pKa = 3.85SAIAQTIINLRR438 pKa = 3.68
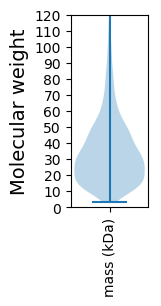
Molecular weight: 45.17 kDa
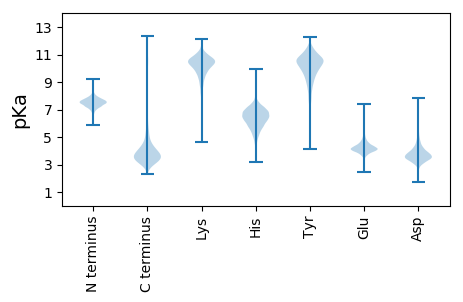
Isoelectric point according different methods:
Protein with the highest isoelectric point:
>tr|A4VFG7|A4VFG7_PSEU5 Glycine--tRNA ligase alpha subunit OS=Pseudomonas stutzeri (strain A1501) OX=379731 GN=glyQ PE=3 SV=1
MM1 pKa = 7.45KK2 pKa = 9.56RR3 pKa = 11.84TFQPSTIKK11 pKa = 10.52RR12 pKa = 11.84ARR14 pKa = 11.84THH16 pKa = 5.94GFRR19 pKa = 11.84ARR21 pKa = 11.84MATKK25 pKa = 10.29NGRR28 pKa = 11.84QVLSRR33 pKa = 11.84RR34 pKa = 11.84RR35 pKa = 11.84AKK37 pKa = 9.83GRR39 pKa = 11.84KK40 pKa = 8.88RR41 pKa = 11.84LTVV44 pKa = 3.11
MM1 pKa = 7.45KK2 pKa = 9.56RR3 pKa = 11.84TFQPSTIKK11 pKa = 10.52RR12 pKa = 11.84ARR14 pKa = 11.84THH16 pKa = 5.94GFRR19 pKa = 11.84ARR21 pKa = 11.84MATKK25 pKa = 10.29NGRR28 pKa = 11.84QVLSRR33 pKa = 11.84RR34 pKa = 11.84RR35 pKa = 11.84AKK37 pKa = 9.83GRR39 pKa = 11.84KK40 pKa = 8.88RR41 pKa = 11.84LTVV44 pKa = 3.11
Molecular weight: 5.21 kDa
Isoelectric point according different methods:
Peptides (in silico digests for buttom-up proteomics)
Below you can find in silico digests of the whole proteome with Trypsin, Chymotrypsin, Trypsin+LysC, LysN, ArgC proteases suitable for different mass spec machines.| Try ESI |
 |
|---|
| ChTry ESI |
|
|---|
| ArgC ESI |
|
|---|
| LysN ESI |
|
|---|
| TryLysC ESI |
|
|---|
| Try MALDI |
|
|---|
| ChTry MALDI |
|
|---|
| ArgC MALDI |
|
|---|
| LysN MALDI |
|
|---|
| TryLysC MALDI |
|
|---|
| Try LTQ |
|
|---|
| ChTry LTQ |
|
|---|
| ArgC LTQ |
|
|---|
| LysN LTQ |
|
|---|
| TryLysC LTQ |
|
|---|
| Try MSlow |
|
|---|
| ChTry MSlow |
|
|---|
| ArgC MSlow |
|
|---|
| LysN MSlow |
|
|---|
| TryLysC MSlow |
|
|---|
| Try MShigh |
|
|---|
| ChTry MShigh |
|
|---|
| ArgC MShigh |
|
|---|
| LysN MShigh |
|
|---|
| TryLysC MShigh |
|
|---|
General Statistics
Number of major isoforms |
Number of additional isoforms |
Number of all proteins |
Number of amino acids |
Min. Seq. Length |
Max. Seq. Length |
Avg. Seq. Length |
Avg. Mol. Weight |
|---|---|---|---|---|---|---|---|
0 |
1346991 |
31 |
2444 |
329.2 |
36.19 |
Amino acid frequency
Ala |
Cys |
Asp |
Glu |
Phe |
Gly |
His |
Ile |
Lys |
Leu |
|---|---|---|---|---|---|---|---|---|---|
11.315 ± 0.043 | 1.046 ± 0.013 |
5.345 ± 0.031 | 6.131 ± 0.034 |
3.564 ± 0.023 | 7.979 ± 0.034 |
2.305 ± 0.018 | 4.645 ± 0.028 |
3.089 ± 0.032 | 12.01 ± 0.06 |
Met |
Asn |
Gln |
Pro |
Arg |
Ser |
Thr |
Val |
Trp |
Tyr |
|---|---|---|---|---|---|---|---|---|---|
2.316 ± 0.017 | 2.744 ± 0.023 |
4.944 ± 0.027 | 4.545 ± 0.03 |
7.234 ± 0.033 | 5.484 ± 0.026 |
4.532 ± 0.023 | 6.895 ± 0.031 |
1.428 ± 0.016 | 2.45 ± 0.019 |
Most of the basic statistics you can see at this page can be downloaded from this CSV file
See this proteome in:

Proteome-pI is available under Creative Commons Attribution-NoDerivs license, for more details see here
| Reference: Kozlowski LP. Proteome-pI 2.0: Proteome Isoelectric Point Database Update. Nucleic Acids Res. 2021, doi: 10.1093/nar/gkab944 | Contact: Lukasz P. Kozlowski |