Bdellovibrio bacteriovorus W
Taxonomy: cellular organisms; Bacteria; Proteobacteria; Oligoflexia; Bdellovibrionales; Bdellovibrionaceae; Bdellovibrio; Bdellovibrio bacteriovorus
Average proteome isoelectric point is 6.79
Get precalculated fractions of proteins
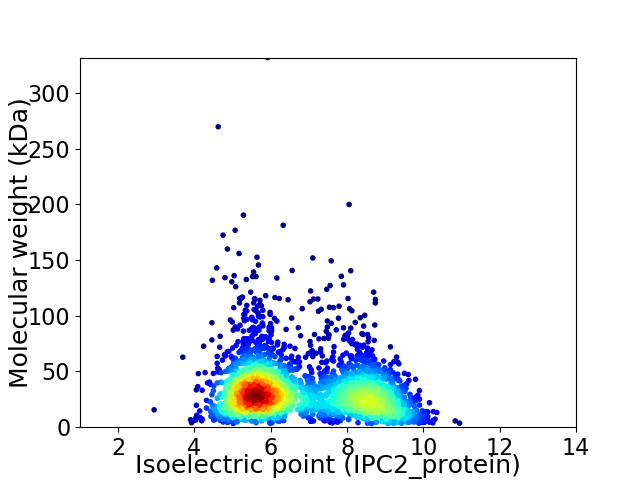
Virtual 2D-PAGE plot for 2854 proteins (isoelectric point calculated using IPC2_protein)
Get csv file with sequences according to given criteria:
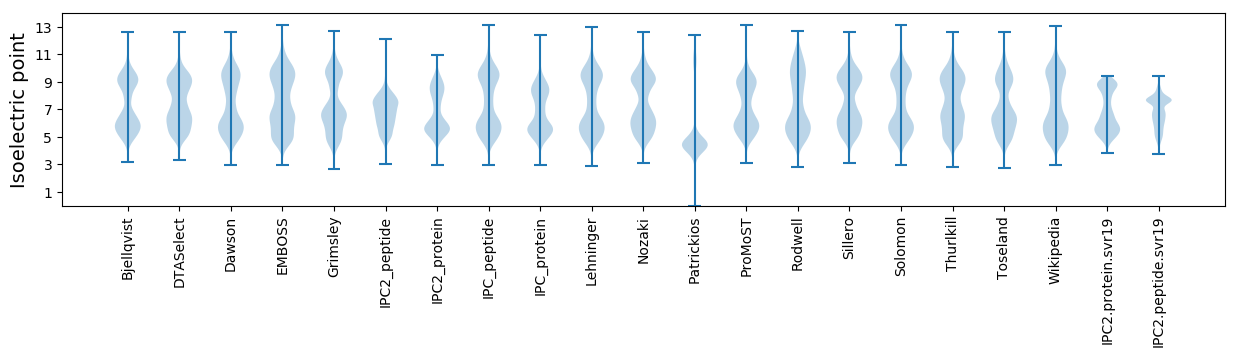
* You can choose from 21 different methods for calculating isoelectric point
Summary statistics related to proteome-wise predictions
Protein with the lowest isoelectric point:
>tr|W5WW32|W5WW32_BDEBC S-adenosylmethionine synthase OS=Bdellovibrio bacteriovorus W OX=765869 GN=metK PE=3 SV=1
MM1 pKa = 7.65AEE3 pKa = 5.46KK4 pKa = 10.01GQKK7 pKa = 8.44WNEE10 pKa = 3.66NVAGKK15 pKa = 9.6MYY17 pKa = 10.82VDD19 pKa = 4.2QSCIACDD26 pKa = 3.66ACILTAPNNFAMHH39 pKa = 7.33DD40 pKa = 3.88EE41 pKa = 4.87DD42 pKa = 3.58GHH44 pKa = 7.96AFVVKK49 pKa = 10.41QPSTPEE55 pKa = 3.89EE56 pKa = 4.06EE57 pKa = 4.55EE58 pKa = 4.34LCQEE62 pKa = 4.53AMDD65 pKa = 4.45GCPVEE70 pKa = 5.77AIGSDD75 pKa = 3.5GDD77 pKa = 3.51QQ78 pKa = 3.29
MM1 pKa = 7.65AEE3 pKa = 5.46KK4 pKa = 10.01GQKK7 pKa = 8.44WNEE10 pKa = 3.66NVAGKK15 pKa = 9.6MYY17 pKa = 10.82VDD19 pKa = 4.2QSCIACDD26 pKa = 3.66ACILTAPNNFAMHH39 pKa = 7.33DD40 pKa = 3.88EE41 pKa = 4.87DD42 pKa = 3.58GHH44 pKa = 7.96AFVVKK49 pKa = 10.41QPSTPEE55 pKa = 3.89EE56 pKa = 4.06EE57 pKa = 4.55EE58 pKa = 4.34LCQEE62 pKa = 4.53AMDD65 pKa = 4.45GCPVEE70 pKa = 5.77AIGSDD75 pKa = 3.5GDD77 pKa = 3.51QQ78 pKa = 3.29
Molecular weight: 8.45 kDa
Isoelectric point according different methods:
Protein with the highest isoelectric point:
>tr|W5WXI2|W5WXI2_BDEBC S-adenosyl-L-homocysteine hydrolase OS=Bdellovibrio bacteriovorus W OX=765869 GN=BDW_04615 PE=3 SV=1
MM1 pKa = 7.31AVKK4 pKa = 10.32GKK6 pKa = 9.02SKK8 pKa = 10.55KK9 pKa = 10.3GIRR12 pKa = 11.84HH13 pKa = 4.79KK14 pKa = 10.14MKK16 pKa = 10.62RR17 pKa = 11.84IAKK20 pKa = 7.81KK21 pKa = 10.22KK22 pKa = 9.82RR23 pKa = 11.84MIRR26 pKa = 11.84VKK28 pKa = 10.61KK29 pKa = 10.3RR30 pKa = 2.95
MM1 pKa = 7.31AVKK4 pKa = 10.32GKK6 pKa = 9.02SKK8 pKa = 10.55KK9 pKa = 10.3GIRR12 pKa = 11.84HH13 pKa = 4.79KK14 pKa = 10.14MKK16 pKa = 10.62RR17 pKa = 11.84IAKK20 pKa = 7.81KK21 pKa = 10.22KK22 pKa = 9.82RR23 pKa = 11.84MIRR26 pKa = 11.84VKK28 pKa = 10.61KK29 pKa = 10.3RR30 pKa = 2.95
Molecular weight: 3.62 kDa
Isoelectric point according different methods:
Peptides (in silico digests for buttom-up proteomics)
Below you can find in silico digests of the whole proteome with Trypsin, Chymotrypsin, Trypsin+LysC, LysN, ArgC proteases suitable for different mass spec machines.| Try ESI |
 |
|---|
| ChTry ESI |
|
|---|
| ArgC ESI |
|
|---|
| LysN ESI |
|
|---|
| TryLysC ESI |
|
|---|
| Try MALDI |
|
|---|
| ChTry MALDI |
|
|---|
| ArgC MALDI |
|
|---|
| LysN MALDI |
|
|---|
| TryLysC MALDI |
|
|---|
| Try LTQ |
|
|---|
| ChTry LTQ |
|
|---|
| ArgC LTQ |
|
|---|
| LysN LTQ |
|
|---|
| TryLysC LTQ |
|
|---|
| Try MSlow |
|
|---|
| ChTry MSlow |
|
|---|
| ArgC MSlow |
|
|---|
| LysN MSlow |
|
|---|
| TryLysC MSlow |
|
|---|
| Try MShigh |
|
|---|
| ChTry MShigh |
|
|---|
| ArgC MShigh |
|
|---|
| LysN MShigh |
|
|---|
| TryLysC MShigh |
|
|---|
General Statistics
Number of major isoforms |
Number of additional isoforms |
Number of all proteins |
Number of amino acids |
Min. Seq. Length |
Max. Seq. Length |
Avg. Seq. Length |
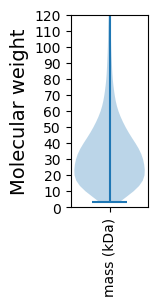
Avg. Mol. Weight |
|---|---|---|---|---|---|---|---|
0 |
902569 |
30 |
2884 |
316.2 |
35.28 |
Amino acid frequency
Ala |
Cys |
Asp |
Glu |
Phe |
Gly |
His |
Ile |
Lys |
Leu |
|---|---|---|---|---|---|---|---|---|---|
7.884 ± 0.047 | 0.895 ± 0.016 |
5.056 ± 0.027 | 6.685 ± 0.048 |
4.735 ± 0.039 | 6.825 ± 0.046 |
1.935 ± 0.022 | 6.22 ± 0.038 |
6.789 ± 0.047 | 9.946 ± 0.05 |
Met |
Asn |
Gln |
Pro |
Arg |
Ser |
Thr |
Val |
Trp |
Tyr |
|---|---|---|---|---|---|---|---|---|---|
2.512 ± 0.026 | 4.302 ± 0.034 |
4.02 ± 0.029 | 3.966 ± 0.033 |
4.707 ± 0.036 | 7.425 ± 0.045 |
5.185 ± 0.043 | 6.746 ± 0.037 |
1.148 ± 0.019 | 3.017 ± 0.025 |
Most of the basic statistics you can see at this page can be downloaded from this CSV file
See this proteome in:

Proteome-pI is available under Creative Commons Attribution-NoDerivs license, for more details see here
| Reference: Kozlowski LP. Proteome-pI 2.0: Proteome Isoelectric Point Database Update. Nucleic Acids Res. 2021, doi: 10.1093/nar/gkab944 | Contact: Lukasz P. Kozlowski |