Dethiosulfatarculus sandiegensis
Taxonomy: cellular organisms; Bacteria; Proteobacteria; delta/epsilon subdivisions; Deltaproteobacteria; Desulfarculales; Desulfarculaceae; Dethiosulfatarculus
Average proteome isoelectric point is 7.05
Get precalculated fractions of proteins
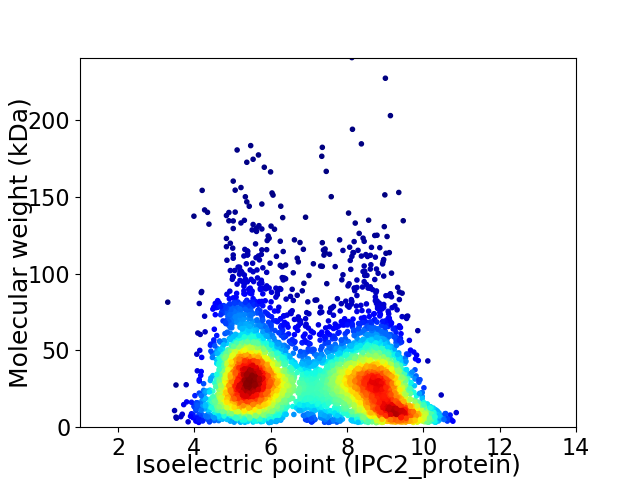
Virtual 2D-PAGE plot for 5388 proteins (isoelectric point calculated using IPC2_protein)
Get csv file with sequences according to given criteria:
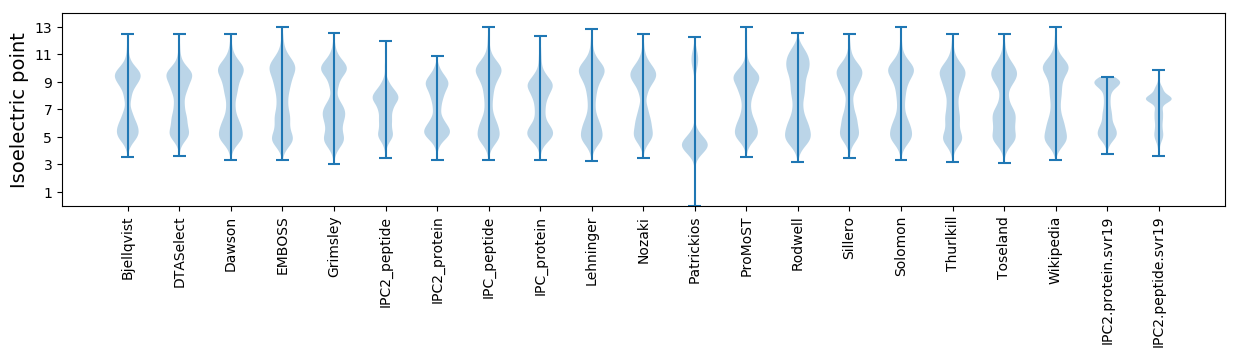
* You can choose from 21 different methods for calculating isoelectric point
Summary statistics related to proteome-wise predictions
Protein with the lowest isoelectric point:
>tr|A0A0D2GBJ9|A0A0D2GBJ9_9DELT Uncharacterized protein OS=Dethiosulfatarculus sandiegensis OX=1429043 GN=X474_19730 PE=4 SV=1
MM1 pKa = 7.8PIEE4 pKa = 4.63FDD6 pKa = 4.35PNTSTYY12 pKa = 9.68YY13 pKa = 8.23QTSYY17 pKa = 8.85TQNSYY22 pKa = 10.97AQAPVEE28 pKa = 4.47NPPPTPTGPQDD39 pKa = 3.24PAQAVSAEE47 pKa = 4.14KK48 pKa = 10.44QIPQDD53 pKa = 3.49PALVEE58 pKa = 4.2PQDD61 pKa = 3.48RR62 pKa = 11.84PRR64 pKa = 11.84PSGQEE69 pKa = 3.63TSLTGSIVDD78 pKa = 3.7TVVV81 pKa = 2.4
MM1 pKa = 7.8PIEE4 pKa = 4.63FDD6 pKa = 4.35PNTSTYY12 pKa = 9.68YY13 pKa = 8.23QTSYY17 pKa = 8.85TQNSYY22 pKa = 10.97AQAPVEE28 pKa = 4.47NPPPTPTGPQDD39 pKa = 3.24PAQAVSAEE47 pKa = 4.14KK48 pKa = 10.44QIPQDD53 pKa = 3.49PALVEE58 pKa = 4.2PQDD61 pKa = 3.48RR62 pKa = 11.84PRR64 pKa = 11.84PSGQEE69 pKa = 3.63TSLTGSIVDD78 pKa = 3.7TVVV81 pKa = 2.4
Molecular weight: 8.74 kDa
Isoelectric point according different methods:
Protein with the highest isoelectric point:
>tr|A0A0D2G7A7|A0A0D2G7A7_9DELT Cytochrome C OS=Dethiosulfatarculus sandiegensis OX=1429043 GN=X474_26750 PE=4 SV=1
MM1 pKa = 7.69RR2 pKa = 11.84RR3 pKa = 11.84LSKK6 pKa = 10.66KK7 pKa = 9.78GAQKK11 pKa = 11.18ALLVSQKK18 pKa = 10.21HH19 pKa = 5.43HH20 pKa = 6.3LQIQGRR26 pKa = 11.84FAFALVVRR34 pKa = 5.09
MM1 pKa = 7.69RR2 pKa = 11.84RR3 pKa = 11.84LSKK6 pKa = 10.66KK7 pKa = 9.78GAQKK11 pKa = 11.18ALLVSQKK18 pKa = 10.21HH19 pKa = 5.43HH20 pKa = 6.3LQIQGRR26 pKa = 11.84FAFALVVRR34 pKa = 5.09
Molecular weight: 3.92 kDa
Isoelectric point according different methods:
Peptides (in silico digests for buttom-up proteomics)
Below you can find in silico digests of the whole proteome with Trypsin, Chymotrypsin, Trypsin+LysC, LysN, ArgC proteases suitable for different mass spec machines.| Try ESI |
 |
|---|
| ChTry ESI |
|
|---|
| ArgC ESI |
|
|---|
| LysN ESI |
|
|---|
| TryLysC ESI |
|
|---|
| Try MALDI |
|
|---|
| ChTry MALDI |
|
|---|
| ArgC MALDI |
|
|---|
| LysN MALDI |
|
|---|
| TryLysC MALDI |
|
|---|
| Try LTQ |
|
|---|
| ChTry LTQ |
|
|---|
| ArgC LTQ |
|
|---|
| LysN LTQ |
|
|---|
| TryLysC LTQ |
|
|---|
| Try MSlow |
|
|---|
| ChTry MSlow |
|
|---|
| ArgC MSlow |
|
|---|
| LysN MSlow |
|
|---|
| TryLysC MSlow |
|
|---|
| Try MShigh |
|
|---|
| ChTry MShigh |
|
|---|
| ArgC MShigh |
|
|---|
| LysN MShigh |
|
|---|
| TryLysC MShigh |
|
|---|
General Statistics
Number of major isoforms |
Number of additional isoforms |
Number of all proteins |
Number of amino acids |
Min. Seq. Length |
Max. Seq. Length |
Avg. Seq. Length |
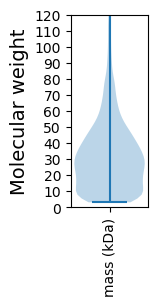
Avg. Mol. Weight |
|---|---|---|---|---|---|---|---|
0 |
1659360 |
29 |
2205 |
308.0 |
34.06 |
Amino acid frequency
Ala |
Cys |
Asp |
Glu |
Phe |
Gly |
His |
Ile |
Lys |
Leu |
|---|---|---|---|---|---|---|---|---|---|
9.122 ± 0.036 | 1.239 ± 0.014 |
5.062 ± 0.026 | 6.372 ± 0.037 |
4.126 ± 0.022 | 7.944 ± 0.034 |
1.922 ± 0.014 | 5.398 ± 0.031 |
6.176 ± 0.035 | 11.221 ± 0.044 |
Met |
Asn |
Gln |
Pro |
Arg |
Ser |
Thr |
Val |
Trp |
Tyr |
|---|---|---|---|---|---|---|---|---|---|
2.787 ± 0.015 | 3.444 ± 0.024 |
4.808 ± 0.025 | 3.709 ± 0.02 |
5.421 ± 0.03 | 5.632 ± 0.023 |
4.77 ± 0.022 | 6.917 ± 0.028 |
1.236 ± 0.014 | 2.693 ± 0.02 |
Most of the basic statistics you can see at this page can be downloaded from this CSV file
See this proteome in:

Proteome-pI is available under Creative Commons Attribution-NoDerivs license, for more details see here
| Reference: Kozlowski LP. Proteome-pI 2.0: Proteome Isoelectric Point Database Update. Nucleic Acids Res. 2021, doi: 10.1093/nar/gkab944 | Contact: Lukasz P. Kozlowski |