Pseudomonas sp. DMKU_BBB3-04
Taxonomy: cellular organisms; Bacteria; Proteobacteria; Gammaproteobacteria; Pseudomonadales; Pseudomonadaceae; Pseudomonas; unclassified Pseudomonas
Average proteome isoelectric point is 6.48
Get precalculated fractions of proteins
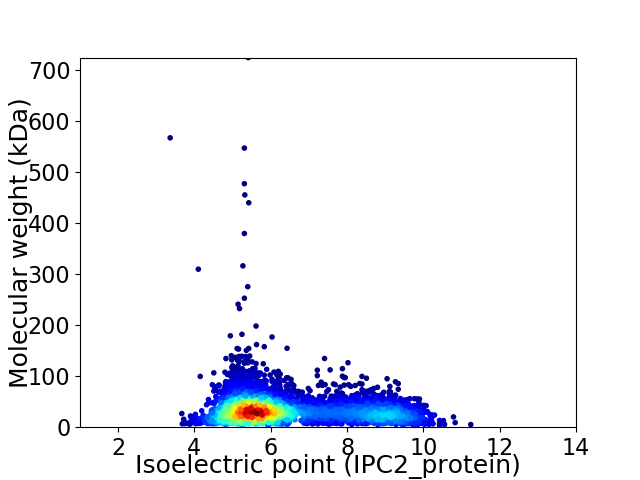
Virtual 2D-PAGE plot for 4165 proteins (isoelectric point calculated using IPC2_protein)
Get csv file with sequences according to given criteria:
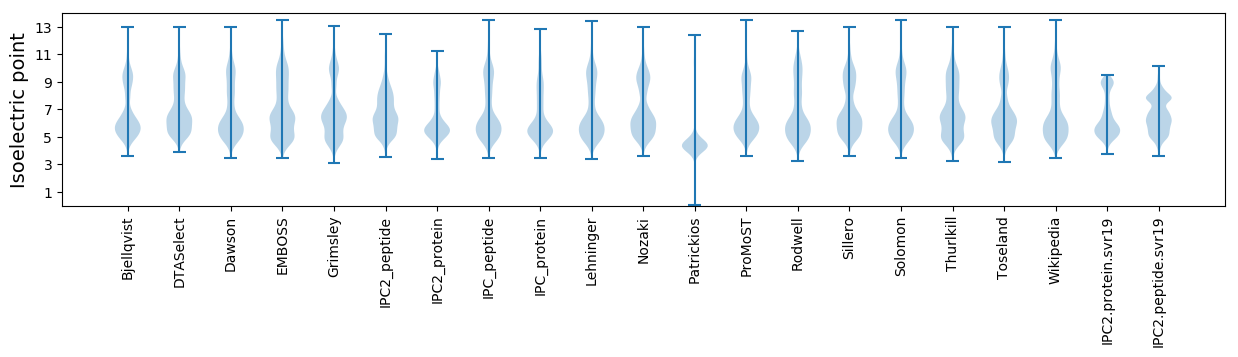
* You can choose from 21 different methods for calculating isoelectric point
Summary statistics related to proteome-wise predictions
Protein with the lowest isoelectric point:
>tr|A0A553GVJ3|A0A553GVJ3_9PSED Lysozyme OS=Pseudomonas sp. DMKU_BBB3-04 OX=2593654 GN=FM069_17850 PE=4 SV=1
MM1 pKa = 7.56KK2 pKa = 10.16KK3 pKa = 8.28WQCVVCGLIYY13 pKa = 10.71DD14 pKa = 4.34EE15 pKa = 5.33AEE17 pKa = 3.76GWPDD21 pKa = 3.44DD22 pKa = 4.59GIVAGTRR29 pKa = 11.84WEE31 pKa = 4.35DD32 pKa = 3.76VPADD36 pKa = 4.15WLCPDD41 pKa = 4.51CGVGKK46 pKa = 10.5ADD48 pKa = 4.11FEE50 pKa = 4.64MIEE53 pKa = 4.1IAA55 pKa = 5.16
MM1 pKa = 7.56KK2 pKa = 10.16KK3 pKa = 8.28WQCVVCGLIYY13 pKa = 10.71DD14 pKa = 4.34EE15 pKa = 5.33AEE17 pKa = 3.76GWPDD21 pKa = 3.44DD22 pKa = 4.59GIVAGTRR29 pKa = 11.84WEE31 pKa = 4.35DD32 pKa = 3.76VPADD36 pKa = 4.15WLCPDD41 pKa = 4.51CGVGKK46 pKa = 10.5ADD48 pKa = 4.11FEE50 pKa = 4.64MIEE53 pKa = 4.1IAA55 pKa = 5.16
Molecular weight: 6.13 kDa
Isoelectric point according different methods:
Protein with the highest isoelectric point:
>tr|A0A553GWL9|A0A553GWL9_9PSED Cytochrome c oxidase assembly protein CtaG OS=Pseudomonas sp. DMKU_BBB3-04 OX=2593654 GN=FM069_15795 PE=3 SV=1
MM1 pKa = 7.45KK2 pKa = 9.56RR3 pKa = 11.84TFQPSTLKK11 pKa = 10.52RR12 pKa = 11.84ARR14 pKa = 11.84THH16 pKa = 5.94GFRR19 pKa = 11.84ARR21 pKa = 11.84MATKK25 pKa = 10.29NGRR28 pKa = 11.84QVLSRR33 pKa = 11.84RR34 pKa = 11.84RR35 pKa = 11.84AKK37 pKa = 9.83GRR39 pKa = 11.84KK40 pKa = 8.88RR41 pKa = 11.84LTVV44 pKa = 3.11
MM1 pKa = 7.45KK2 pKa = 9.56RR3 pKa = 11.84TFQPSTLKK11 pKa = 10.52RR12 pKa = 11.84ARR14 pKa = 11.84THH16 pKa = 5.94GFRR19 pKa = 11.84ARR21 pKa = 11.84MATKK25 pKa = 10.29NGRR28 pKa = 11.84QVLSRR33 pKa = 11.84RR34 pKa = 11.84RR35 pKa = 11.84AKK37 pKa = 9.83GRR39 pKa = 11.84KK40 pKa = 8.88RR41 pKa = 11.84LTVV44 pKa = 3.11
Molecular weight: 5.21 kDa
Isoelectric point according different methods:
Peptides (in silico digests for buttom-up proteomics)
Below you can find in silico digests of the whole proteome with Trypsin, Chymotrypsin, Trypsin+LysC, LysN, ArgC proteases suitable for different mass spec machines.| Try ESI |
 |
|---|
| ChTry ESI |
|
|---|
| ArgC ESI |
|
|---|
| LysN ESI |
|
|---|
| TryLysC ESI |
|
|---|
| Try MALDI |
|
|---|
| ChTry MALDI |
|
|---|
| ArgC MALDI |
|
|---|
| LysN MALDI |
|
|---|
| TryLysC MALDI |
|
|---|
| Try LTQ |
|
|---|
| ChTry LTQ |
|
|---|
| ArgC LTQ |
|
|---|
| LysN LTQ |
|
|---|
| TryLysC LTQ |
|
|---|
| Try MSlow |
|
|---|
| ChTry MSlow |
|
|---|
| ArgC MSlow |
|
|---|
| LysN MSlow |
|
|---|
| TryLysC MSlow |
|
|---|
| Try MShigh |
|
|---|
| ChTry MShigh |
|
|---|
| ArgC MShigh |
|
|---|
| LysN MShigh |
|
|---|
| TryLysC MShigh |
|
|---|
General Statistics
Number of major isoforms |
Number of additional isoforms |
Number of all proteins |
Number of amino acids |
Min. Seq. Length |
Max. Seq. Length |
Avg. Seq. Length |
Avg. Mol. Weight |
|---|---|---|---|---|---|---|---|
0 |
1375172 |
28 |
6706 |
330.2 |
36.14 |
Amino acid frequency
Ala |
Cys |
Asp |
Glu |
Phe |
Gly |
His |
Ile |
Lys |
Leu |
|---|---|---|---|---|---|---|---|---|---|
11.935 ± 0.054 | 0.988 ± 0.014 |
5.733 ± 0.031 | 5.773 ± 0.037 |
3.491 ± 0.021 | 8.295 ± 0.036 |
2.291 ± 0.021 | 4.053 ± 0.031 |
2.733 ± 0.039 | 12.253 ± 0.061 |
Met |
Asn |
Gln |
Pro |
Arg |
Ser |
Thr |
Val |
Trp |
Tyr |
|---|---|---|---|---|---|---|---|---|---|
2.019 ± 0.019 | 2.451 ± 0.028 |
5.341 ± 0.034 | 4.141 ± 0.025 |
7.654 ± 0.051 | 5.172 ± 0.033 |
4.608 ± 0.044 | 7.136 ± 0.035 |
1.428 ± 0.018 | 2.506 ± 0.019 |
Most of the basic statistics you can see at this page can be downloaded from this CSV file
See this proteome in:

Proteome-pI is available under Creative Commons Attribution-NoDerivs license, for more details see here
| Reference: Kozlowski LP. Proteome-pI 2.0: Proteome Isoelectric Point Database Update. Nucleic Acids Res. 2021, doi: 10.1093/nar/gkab944 | Contact: Lukasz P. Kozlowski |