Aeromonas phage phiAS5
Taxonomy: Viruses; Duplodnaviria; Heunggongvirae; Uroviricota; Caudoviricetes; Caudovirales; Myoviridae; Tevenvirinae; unclassified Tevenvirinae
Average proteome isoelectric point is 6.41
Get precalculated fractions of proteins
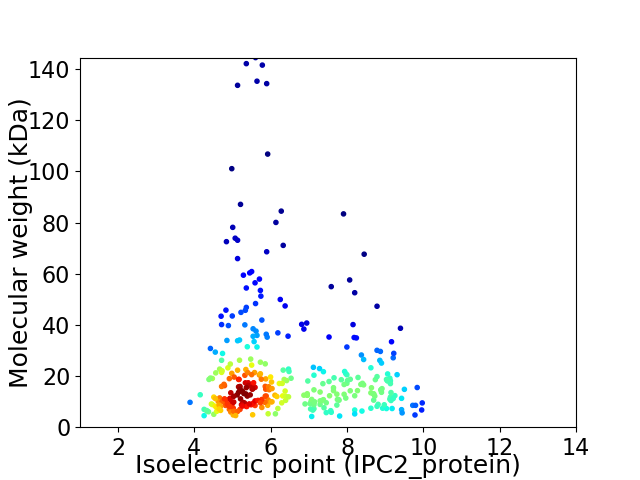
Virtual 2D-PAGE plot for 343 proteins (isoelectric point calculated using IPC2_protein)
Get csv file with sequences according to given criteria:
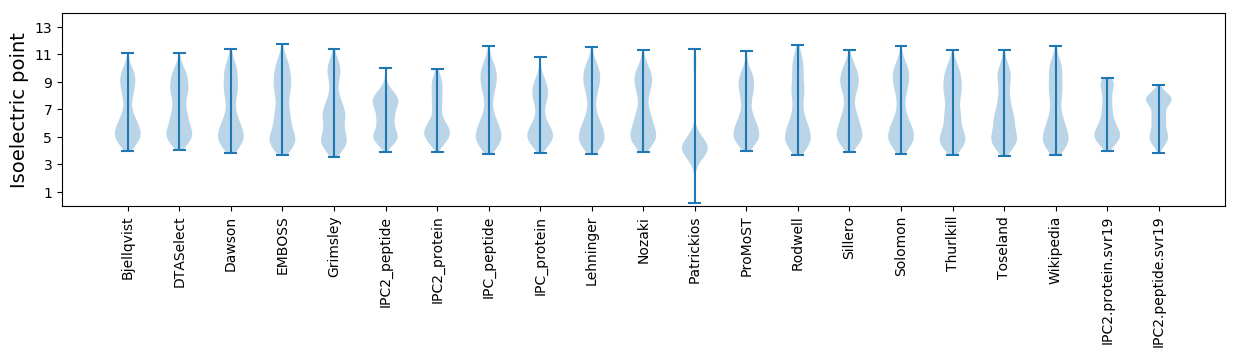
* You can choose from 21 different methods for calculating isoelectric point
Summary statistics related to proteome-wise predictions
Protein with the lowest isoelectric point:
>tr|E1A2V4|E1A2V4_9CAUD Uncharacterized protein OS=Aeromonas phage phiAS5 OX=879630 GN=phiAS5_ORF0207 PE=4 SV=1
MM1 pKa = 7.46TNQEE5 pKa = 4.22VIALGLTLVNVIYY18 pKa = 10.39GIGVVSFLEE27 pKa = 3.89IWDD30 pKa = 3.83EE31 pKa = 3.73QDD33 pKa = 3.23TIKK36 pKa = 10.7RR37 pKa = 11.84AIVGLTAMIPFFALSYY53 pKa = 10.78FLLNYY58 pKa = 10.46CEE60 pKa = 4.59VII62 pKa = 3.63
MM1 pKa = 7.46TNQEE5 pKa = 4.22VIALGLTLVNVIYY18 pKa = 10.39GIGVVSFLEE27 pKa = 3.89IWDD30 pKa = 3.83EE31 pKa = 3.73QDD33 pKa = 3.23TIKK36 pKa = 10.7RR37 pKa = 11.84AIVGLTAMIPFFALSYY53 pKa = 10.78FLLNYY58 pKa = 10.46CEE60 pKa = 4.59VII62 pKa = 3.63
Molecular weight: 6.97 kDa
Isoelectric point according different methods:
Protein with the highest isoelectric point:
>tr|E1A2T0|E1A2T0_9CAUD Uncharacterized protein OS=Aeromonas phage phiAS5 OX=879630 GN=phiAS5_ORF0183 PE=4 SV=1
MM1 pKa = 7.52NIFKK5 pKa = 10.87RR6 pKa = 11.84LLNRR10 pKa = 11.84MKK12 pKa = 9.73YY13 pKa = 10.57KK14 pKa = 10.8PMIKK18 pKa = 9.57INAYY22 pKa = 10.28AMQIHH27 pKa = 6.06TASGASVCTPDD38 pKa = 5.23GIAVKK43 pKa = 10.39QRR45 pKa = 11.84IEE47 pKa = 3.81RR48 pKa = 11.84LKK50 pKa = 10.92RR51 pKa = 11.84EE52 pKa = 3.94MKK54 pKa = 10.22INRR57 pKa = 11.84GG58 pKa = 3.38
MM1 pKa = 7.52NIFKK5 pKa = 10.87RR6 pKa = 11.84LLNRR10 pKa = 11.84MKK12 pKa = 9.73YY13 pKa = 10.57KK14 pKa = 10.8PMIKK18 pKa = 9.57INAYY22 pKa = 10.28AMQIHH27 pKa = 6.06TASGASVCTPDD38 pKa = 5.23GIAVKK43 pKa = 10.39QRR45 pKa = 11.84IEE47 pKa = 3.81RR48 pKa = 11.84LKK50 pKa = 10.92RR51 pKa = 11.84EE52 pKa = 3.94MKK54 pKa = 10.22INRR57 pKa = 11.84GG58 pKa = 3.38
Molecular weight: 6.74 kDa
Isoelectric point according different methods:
Peptides (in silico digests for buttom-up proteomics)
Below you can find in silico digests of the whole proteome with Trypsin, Chymotrypsin, Trypsin+LysC, LysN, ArgC proteases suitable for different mass spec machines.| Try ESI |
 |
|---|
| ChTry ESI |
|
|---|
| ArgC ESI |
|
|---|
| LysN ESI |
|
|---|
| TryLysC ESI |
|
|---|
| Try MALDI |
|
|---|
| ChTry MALDI |
|
|---|
| ArgC MALDI |
|
|---|
| LysN MALDI |
|
|---|
| TryLysC MALDI |
|
|---|
| Try LTQ |
|
|---|
| ChTry LTQ |
|
|---|
| ArgC LTQ |
|
|---|
| LysN LTQ |
|
|---|
| TryLysC LTQ |
|
|---|
| Try MSlow |
|
|---|
| ChTry MSlow |
|
|---|
| ArgC MSlow |
|
|---|
| LysN MSlow |
|
|---|
| TryLysC MSlow |
|
|---|
| Try MShigh |
|
|---|
| ChTry MShigh |
|
|---|
| ArgC MShigh |
|
|---|
| LysN MShigh |
|
|---|
| TryLysC MShigh |
|
|---|
General Statistics
Number of major isoforms |
Number of additional isoforms |
Number of all proteins |
Number of amino acids |
Min. Seq. Length |
Max. Seq. Length |
Avg. Seq. Length |
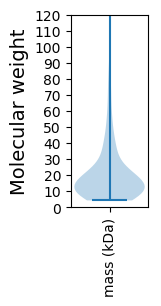
Avg. Mol. Weight |
|---|---|---|---|---|---|---|---|
0 |
69023 |
37 |
1331 |
201.2 |
22.8 |
Amino acid frequency
Ala |
Cys |
Asp |
Glu |
Phe |
Gly |
His |
Ile |
Lys |
Leu |
|---|---|---|---|---|---|---|---|---|---|
6.947 ± 0.166 | 1.214 ± 0.069 |
6.428 ± 0.09 | 6.753 ± 0.162 |
4.265 ± 0.088 | 6.449 ± 0.2 |
1.985 ± 0.07 | 6.757 ± 0.116 |
7.316 ± 0.166 | 6.917 ± 0.12 |
Met |
Asn |
Gln |
Pro |
Arg |
Ser |
Thr |
Val |
Trp |
Tyr |
|---|---|---|---|---|---|---|---|---|---|
3.226 ± 0.11 | 5.358 ± 0.115 |
3.183 ± 0.081 | 3.358 ± 0.075 |
5.066 ± 0.096 | 6.026 ± 0.121 |
5.926 ± 0.211 | 7.379 ± 0.111 |
1.291 ± 0.052 | 4.157 ± 0.108 |
Most of the basic statistics you can see at this page can be downloaded from this CSV file
See this proteome in:

Proteome-pI is available under Creative Commons Attribution-NoDerivs license, for more details see here
| Reference: Kozlowski LP. Proteome-pI 2.0: Proteome Isoelectric Point Database Update. Nucleic Acids Res. 2021, doi: 10.1093/nar/gkab944 | Contact: Lukasz P. Kozlowski |