Rhizobium deserti
Taxonomy: cellular organisms; Bacteria; Proteobacteria; Alphaproteobacteria; Hyphomicrobiales; Rhizobiaceae; Rhizobium/Agrobacterium group; Rhizobium
Average proteome isoelectric point is 6.41
Get precalculated fractions of proteins
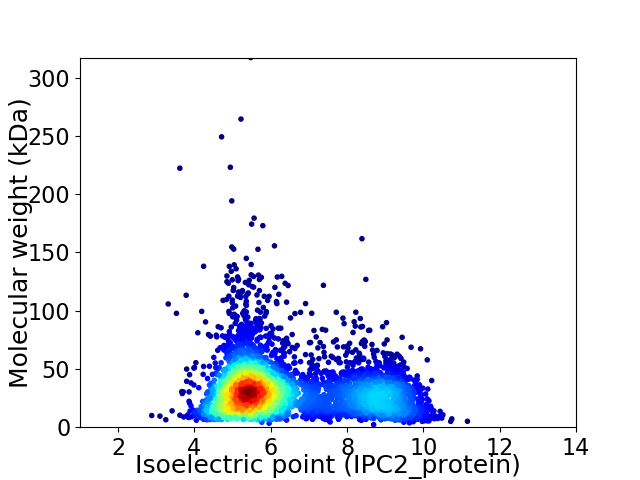
Virtual 2D-PAGE plot for 4410 proteins (isoelectric point calculated using IPC2_protein)
Get csv file with sequences according to given criteria:
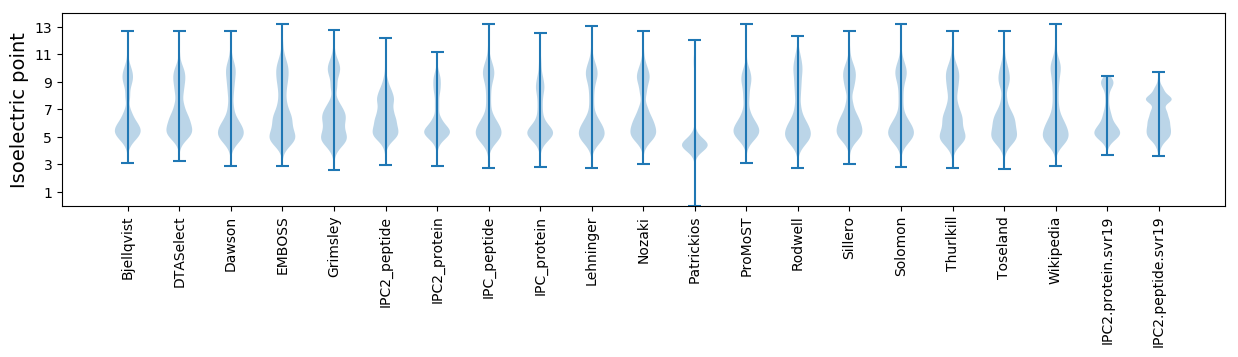
* You can choose from 21 different methods for calculating isoelectric point
Summary statistics related to proteome-wise predictions
Protein with the lowest isoelectric point:
>tr|A0A4R5UKE4|A0A4R5UKE4_9RHIZ Phosphoadenylyl-sulfate reductase OS=Rhizobium deserti OX=2547961 GN=E2F50_10965 PE=3 SV=1
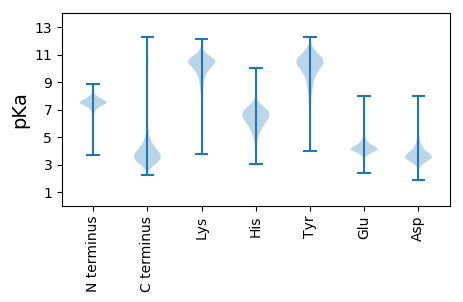
MM1 pKa = 7.49NIKK4 pKa = 10.39SLLLGSAAALAAVSGAQAADD24 pKa = 4.21AIVAAEE30 pKa = 4.47PEE32 pKa = 3.93PMEE35 pKa = 4.1YY36 pKa = 10.8VRR38 pKa = 11.84VCDD41 pKa = 4.28AFGKK45 pKa = 10.52GYY47 pKa = 10.22FYY49 pKa = 10.67IPGTEE54 pKa = 3.83TCLKK58 pKa = 9.33IGGYY62 pKa = 9.13VRR64 pKa = 11.84FQVDD68 pKa = 3.91FDD70 pKa = 4.56DD71 pKa = 4.53VDD73 pKa = 4.1DD74 pKa = 4.47VVAGAGGAVIDD85 pKa = 5.24IDD87 pKa = 4.46DD88 pKa = 5.01DD89 pKa = 3.52NWNARR94 pKa = 11.84TRR96 pKa = 11.84ALINVSAKK104 pKa = 10.52SDD106 pKa = 3.62TEE108 pKa = 4.06YY109 pKa = 11.28GALSSYY115 pKa = 10.36IALRR119 pKa = 11.84SWAEE123 pKa = 3.24GDD125 pKa = 3.81YY126 pKa = 11.34VGDD129 pKa = 4.44GEE131 pKa = 5.36GEE133 pKa = 4.17LNEE136 pKa = 4.58LEE138 pKa = 4.18IDD140 pKa = 3.51EE141 pKa = 5.67AYY143 pKa = 8.4ITLGGFKK150 pKa = 10.22VGYY153 pKa = 9.88AYY155 pKa = 10.66NYY157 pKa = 9.3WDD159 pKa = 3.79IGLSGEE165 pKa = 4.16TDD167 pKa = 3.34DD168 pKa = 6.02LGSNRR173 pKa = 11.84INQIGYY179 pKa = 8.96EE180 pKa = 4.17YY181 pKa = 10.42TSEE184 pKa = 4.19TIKK187 pKa = 11.05AGIFVDD193 pKa = 4.33EE194 pKa = 4.42LTGHH198 pKa = 4.91YY199 pKa = 9.35TEE201 pKa = 5.19NDD203 pKa = 2.89FGAALGTTDD212 pKa = 4.54GYY214 pKa = 11.84GNDD217 pKa = 3.91GVGIEE222 pKa = 4.5AMVSGAFGPISASLLGGYY240 pKa = 10.02DD241 pKa = 3.96FAAEE245 pKa = 4.43DD246 pKa = 4.02GSIRR250 pKa = 11.84GIVSGKK256 pKa = 10.03IGTGTLSVAGIYY268 pKa = 8.61STGANAYY275 pKa = 9.77YY276 pKa = 10.69DD277 pKa = 3.79LAEE280 pKa = 4.0WTVAAEE286 pKa = 4.18YY287 pKa = 10.43AVKK290 pKa = 10.68LGDD293 pKa = 4.19KK294 pKa = 9.13FTITPAFQYY303 pKa = 9.99WDD305 pKa = 3.96SLDD308 pKa = 4.07ADD310 pKa = 4.05LSGDD314 pKa = 3.57FGGDD318 pKa = 2.89RR319 pKa = 11.84NAWRR323 pKa = 11.84AGVTLDD329 pKa = 3.47YY330 pKa = 10.82KK331 pKa = 10.57IVEE334 pKa = 4.37GLTSKK339 pKa = 10.85VSLQYY344 pKa = 11.15TDD346 pKa = 4.05MDD348 pKa = 5.08DD349 pKa = 5.7DD350 pKa = 5.58GDD352 pKa = 3.77ISDD355 pKa = 4.72DD356 pKa = 3.84EE357 pKa = 4.6EE358 pKa = 4.61VFSGFVRR365 pKa = 11.84LQRR368 pKa = 11.84TFF370 pKa = 3.08
MM1 pKa = 7.49NIKK4 pKa = 10.39SLLLGSAAALAAVSGAQAADD24 pKa = 4.21AIVAAEE30 pKa = 4.47PEE32 pKa = 3.93PMEE35 pKa = 4.1YY36 pKa = 10.8VRR38 pKa = 11.84VCDD41 pKa = 4.28AFGKK45 pKa = 10.52GYY47 pKa = 10.22FYY49 pKa = 10.67IPGTEE54 pKa = 3.83TCLKK58 pKa = 9.33IGGYY62 pKa = 9.13VRR64 pKa = 11.84FQVDD68 pKa = 3.91FDD70 pKa = 4.56DD71 pKa = 4.53VDD73 pKa = 4.1DD74 pKa = 4.47VVAGAGGAVIDD85 pKa = 5.24IDD87 pKa = 4.46DD88 pKa = 5.01DD89 pKa = 3.52NWNARR94 pKa = 11.84TRR96 pKa = 11.84ALINVSAKK104 pKa = 10.52SDD106 pKa = 3.62TEE108 pKa = 4.06YY109 pKa = 11.28GALSSYY115 pKa = 10.36IALRR119 pKa = 11.84SWAEE123 pKa = 3.24GDD125 pKa = 3.81YY126 pKa = 11.34VGDD129 pKa = 4.44GEE131 pKa = 5.36GEE133 pKa = 4.17LNEE136 pKa = 4.58LEE138 pKa = 4.18IDD140 pKa = 3.51EE141 pKa = 5.67AYY143 pKa = 8.4ITLGGFKK150 pKa = 10.22VGYY153 pKa = 9.88AYY155 pKa = 10.66NYY157 pKa = 9.3WDD159 pKa = 3.79IGLSGEE165 pKa = 4.16TDD167 pKa = 3.34DD168 pKa = 6.02LGSNRR173 pKa = 11.84INQIGYY179 pKa = 8.96EE180 pKa = 4.17YY181 pKa = 10.42TSEE184 pKa = 4.19TIKK187 pKa = 11.05AGIFVDD193 pKa = 4.33EE194 pKa = 4.42LTGHH198 pKa = 4.91YY199 pKa = 9.35TEE201 pKa = 5.19NDD203 pKa = 2.89FGAALGTTDD212 pKa = 4.54GYY214 pKa = 11.84GNDD217 pKa = 3.91GVGIEE222 pKa = 4.5AMVSGAFGPISASLLGGYY240 pKa = 10.02DD241 pKa = 3.96FAAEE245 pKa = 4.43DD246 pKa = 4.02GSIRR250 pKa = 11.84GIVSGKK256 pKa = 10.03IGTGTLSVAGIYY268 pKa = 8.61STGANAYY275 pKa = 9.77YY276 pKa = 10.69DD277 pKa = 3.79LAEE280 pKa = 4.0WTVAAEE286 pKa = 4.18YY287 pKa = 10.43AVKK290 pKa = 10.68LGDD293 pKa = 4.19KK294 pKa = 9.13FTITPAFQYY303 pKa = 9.99WDD305 pKa = 3.96SLDD308 pKa = 4.07ADD310 pKa = 4.05LSGDD314 pKa = 3.57FGGDD318 pKa = 2.89RR319 pKa = 11.84NAWRR323 pKa = 11.84AGVTLDD329 pKa = 3.47YY330 pKa = 10.82KK331 pKa = 10.57IVEE334 pKa = 4.37GLTSKK339 pKa = 10.85VSLQYY344 pKa = 11.15TDD346 pKa = 4.05MDD348 pKa = 5.08DD349 pKa = 5.7DD350 pKa = 5.58GDD352 pKa = 3.77ISDD355 pKa = 4.72DD356 pKa = 3.84EE357 pKa = 4.6EE358 pKa = 4.61VFSGFVRR365 pKa = 11.84LQRR368 pKa = 11.84TFF370 pKa = 3.08
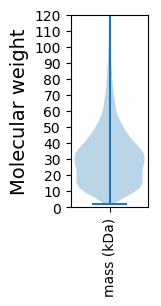
Molecular weight: 39.41 kDa
Isoelectric point according different methods:
Protein with the highest isoelectric point:
>tr|A0A4R5UHC2|A0A4R5UHC2_9RHIZ Transporter substrate-binding domain-containing protein OS=Rhizobium deserti OX=2547961 GN=E2F50_13420 PE=4 SV=1
MM1 pKa = 7.35KK2 pKa = 9.43RR3 pKa = 11.84TYY5 pKa = 10.27QPSKK9 pKa = 9.73LVRR12 pKa = 11.84KK13 pKa = 9.15RR14 pKa = 11.84RR15 pKa = 11.84HH16 pKa = 4.42GFRR19 pKa = 11.84ARR21 pKa = 11.84MATTGGRR28 pKa = 11.84KK29 pKa = 9.01VLAARR34 pKa = 11.84RR35 pKa = 11.84ARR37 pKa = 11.84GRR39 pKa = 11.84ARR41 pKa = 11.84LSAA44 pKa = 3.99
MM1 pKa = 7.35KK2 pKa = 9.43RR3 pKa = 11.84TYY5 pKa = 10.27QPSKK9 pKa = 9.73LVRR12 pKa = 11.84KK13 pKa = 9.15RR14 pKa = 11.84RR15 pKa = 11.84HH16 pKa = 4.42GFRR19 pKa = 11.84ARR21 pKa = 11.84MATTGGRR28 pKa = 11.84KK29 pKa = 9.01VLAARR34 pKa = 11.84RR35 pKa = 11.84ARR37 pKa = 11.84GRR39 pKa = 11.84ARR41 pKa = 11.84LSAA44 pKa = 3.99
Molecular weight: 5.08 kDa
Isoelectric point according different methods:
Peptides (in silico digests for buttom-up proteomics)
Below you can find in silico digests of the whole proteome with Trypsin, Chymotrypsin, Trypsin+LysC, LysN, ArgC proteases suitable for different mass spec machines.| Try ESI |
 |
|---|
| ChTry ESI |
|
|---|
| ArgC ESI |
|
|---|
| LysN ESI |
|
|---|
| TryLysC ESI |
|
|---|
| Try MALDI |
|
|---|
| ChTry MALDI |
|
|---|
| ArgC MALDI |
|
|---|
| LysN MALDI |
|
|---|
| TryLysC MALDI |
|
|---|
| Try LTQ |
|
|---|
| ChTry LTQ |
|
|---|
| ArgC LTQ |
|
|---|
| LysN LTQ |
|
|---|
| TryLysC LTQ |
|
|---|
| Try MSlow |
|
|---|
| ChTry MSlow |
|
|---|
| ArgC MSlow |
|
|---|
| LysN MSlow |
|
|---|
| TryLysC MSlow |
|
|---|
| Try MShigh |
|
|---|
| ChTry MShigh |
|
|---|
| ArgC MShigh |
|
|---|
| LysN MShigh |
|
|---|
| TryLysC MShigh |
|
|---|
General Statistics
Number of major isoforms |
Number of additional isoforms |
Number of all proteins |
Number of amino acids |
Min. Seq. Length |
Max. Seq. Length |
Avg. Seq. Length |
Avg. Mol. Weight |
|---|---|---|---|---|---|---|---|
0 |
1370632 |
17 |
2834 |
310.8 |
33.83 |
Amino acid frequency
Ala |
Cys |
Asp |
Glu |
Phe |
Gly |
His |
Ile |
Lys |
Leu |
|---|---|---|---|---|---|---|---|---|---|
11.774 ± 0.055 | 0.761 ± 0.011 |
5.688 ± 0.028 | 5.899 ± 0.033 |
3.879 ± 0.024 | 8.269 ± 0.031 |
1.993 ± 0.016 | 5.595 ± 0.03 |
3.743 ± 0.025 | 10.034 ± 0.047 |
Met |
Asn |
Gln |
Pro |
Arg |
Ser |
Thr |
Val |
Trp |
Tyr |
|---|---|---|---|---|---|---|---|---|---|
2.647 ± 0.021 | 2.798 ± 0.021 |
4.883 ± 0.028 | 3.355 ± 0.025 |
6.627 ± 0.031 | 5.995 ± 0.03 |
5.228 ± 0.024 | 7.315 ± 0.03 |
1.248 ± 0.013 | 2.271 ± 0.02 |
Most of the basic statistics you can see at this page can be downloaded from this CSV file
See this proteome in:

Proteome-pI is available under Creative Commons Attribution-NoDerivs license, for more details see here
| Reference: Kozlowski LP. Proteome-pI 2.0: Proteome Isoelectric Point Database Update. Nucleic Acids Res. 2021, doi: 10.1093/nar/gkab944 | Contact: Lukasz P. Kozlowski |