Succinatimonas sp. CAG:777
Taxonomy: cellular organisms; Bacteria; Proteobacteria; Gammaproteobacteria; Aeromonadales; Succinivibrionaceae; Succinatimonas; environmental samples
Average proteome isoelectric point is 6.45
Get precalculated fractions of proteins
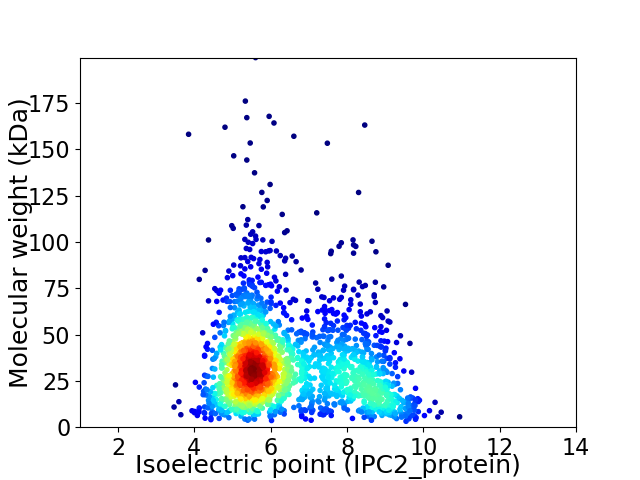
Virtual 2D-PAGE plot for 1970 proteins (isoelectric point calculated using IPC2_protein)
Get csv file with sequences according to given criteria:
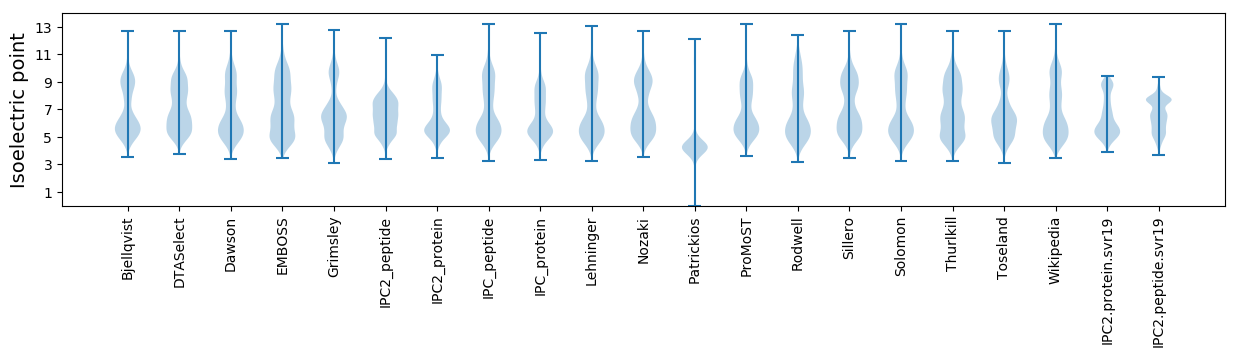
* You can choose from 21 different methods for calculating isoelectric point
Summary statistics related to proteome-wise predictions
Protein with the lowest isoelectric point:
>tr|R5ELA1|R5ELA1_9GAMM Protein TolA OS=Succinatimonas sp. CAG:777 OX=1262974 GN=BN779_00803 PE=4 SV=1
MM1 pKa = 7.19FVINNEE7 pKa = 3.69ICSQCGEE14 pKa = 4.35CQDD17 pKa = 3.86ICPCGAIEE25 pKa = 4.22QQPDD29 pKa = 3.26DD30 pKa = 4.12SFKK33 pKa = 10.56IDD35 pKa = 4.7AEE37 pKa = 4.31MCSDD41 pKa = 4.28CAACQSVCPFEE52 pKa = 6.65AIEE55 pKa = 4.16EE56 pKa = 4.33KK57 pKa = 10.71EE58 pKa = 3.9DD59 pKa = 3.96DD60 pKa = 3.89KK61 pKa = 12.07
MM1 pKa = 7.19FVINNEE7 pKa = 3.69ICSQCGEE14 pKa = 4.35CQDD17 pKa = 3.86ICPCGAIEE25 pKa = 4.22QQPDD29 pKa = 3.26DD30 pKa = 4.12SFKK33 pKa = 10.56IDD35 pKa = 4.7AEE37 pKa = 4.31MCSDD41 pKa = 4.28CAACQSVCPFEE52 pKa = 6.65AIEE55 pKa = 4.16EE56 pKa = 4.33KK57 pKa = 10.71EE58 pKa = 3.9DD59 pKa = 3.96DD60 pKa = 3.89KK61 pKa = 12.07
Molecular weight: 6.73 kDa
Isoelectric point according different methods:
Protein with the highest isoelectric point:
>tr|R5EUU8|R5EUU8_9GAMM Ankyrin OS=Succinatimonas sp. CAG:777 OX=1262974 GN=BN779_00644 PE=4 SV=1
MM1 pKa = 7.44KK2 pKa = 9.52RR3 pKa = 11.84TFQPNVTKK11 pKa = 10.67RR12 pKa = 11.84KK13 pKa = 7.14RR14 pKa = 11.84THH16 pKa = 5.69GFRR19 pKa = 11.84VRR21 pKa = 11.84MRR23 pKa = 11.84TADD26 pKa = 3.23GRR28 pKa = 11.84KK29 pKa = 8.25VLSRR33 pKa = 11.84RR34 pKa = 11.84RR35 pKa = 11.84AKK37 pKa = 9.95GRR39 pKa = 11.84KK40 pKa = 9.09RR41 pKa = 11.84LTTVNGG47 pKa = 3.51
MM1 pKa = 7.44KK2 pKa = 9.52RR3 pKa = 11.84TFQPNVTKK11 pKa = 10.67RR12 pKa = 11.84KK13 pKa = 7.14RR14 pKa = 11.84THH16 pKa = 5.69GFRR19 pKa = 11.84VRR21 pKa = 11.84MRR23 pKa = 11.84TADD26 pKa = 3.23GRR28 pKa = 11.84KK29 pKa = 8.25VLSRR33 pKa = 11.84RR34 pKa = 11.84RR35 pKa = 11.84AKK37 pKa = 9.95GRR39 pKa = 11.84KK40 pKa = 9.09RR41 pKa = 11.84LTTVNGG47 pKa = 3.51
Molecular weight: 5.61 kDa
Isoelectric point according different methods:
Peptides (in silico digests for buttom-up proteomics)
Below you can find in silico digests of the whole proteome with Trypsin, Chymotrypsin, Trypsin+LysC, LysN, ArgC proteases suitable for different mass spec machines.| Try ESI |
 |
|---|
| ChTry ESI |
|
|---|
| ArgC ESI |
|
|---|
| LysN ESI |
|
|---|
| TryLysC ESI |
|
|---|
| Try MALDI |
|
|---|
| ChTry MALDI |
|
|---|
| ArgC MALDI |
|
|---|
| LysN MALDI |
|
|---|
| TryLysC MALDI |
|
|---|
| Try LTQ |
|
|---|
| ChTry LTQ |
|
|---|
| ArgC LTQ |
|
|---|
| LysN LTQ |
|
|---|
| TryLysC LTQ |
|
|---|
| Try MSlow |
|
|---|
| ChTry MSlow |
|
|---|
| ArgC MSlow |
|
|---|
| LysN MSlow |
|
|---|
| TryLysC MSlow |
|
|---|
| Try MShigh |
|
|---|
| ChTry MShigh |
|
|---|
| ArgC MShigh |
|
|---|
| LysN MShigh |
|
|---|
| TryLysC MShigh |
|
|---|
General Statistics
Number of major isoforms |
Number of additional isoforms |
Number of all proteins |
Number of amino acids |
Min. Seq. Length |
Max. Seq. Length |
Avg. Seq. Length |
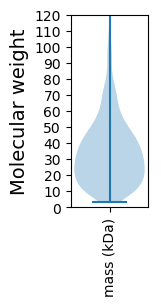
Avg. Mol. Weight |
|---|---|---|---|---|---|---|---|
0 |
633173 |
29 |
1745 |
321.4 |
35.85 |
Amino acid frequency
Ala |
Cys |
Asp |
Glu |
Phe |
Gly |
His |
Ile |
Lys |
Leu |
|---|---|---|---|---|---|---|---|---|---|
7.56 ± 0.063 | 1.43 ± 0.022 |
6.121 ± 0.041 | 6.175 ± 0.045 |
4.548 ± 0.046 | 6.256 ± 0.059 |
1.788 ± 0.022 | 7.044 ± 0.048 |
7.659 ± 0.049 | 9.745 ± 0.054 |
Met |
Asn |
Gln |
Pro |
Arg |
Ser |
Thr |
Val |
Trp |
Tyr |
|---|---|---|---|---|---|---|---|---|---|
2.4 ± 0.025 | 5.168 ± 0.046 |
3.404 ± 0.031 | 3.078 ± 0.033 |
3.936 ± 0.035 | 7.063 ± 0.056 |
5.323 ± 0.036 | 7.004 ± 0.049 |
0.708 ± 0.015 | 3.59 ± 0.037 |
Most of the basic statistics you can see at this page can be downloaded from this CSV file
See this proteome in:

Proteome-pI is available under Creative Commons Attribution-NoDerivs license, for more details see here
| Reference: Kozlowski LP. Proteome-pI 2.0: Proteome Isoelectric Point Database Update. Nucleic Acids Res. 2021, doi: 10.1093/nar/gkab944 | Contact: Lukasz P. Kozlowski |