Hyposoter fugitivus ichnovirus
Taxonomy: Viruses; Polydnaviridae; Ichnovirus
Average proteome isoelectric point is 7.2
Get precalculated fractions of proteins
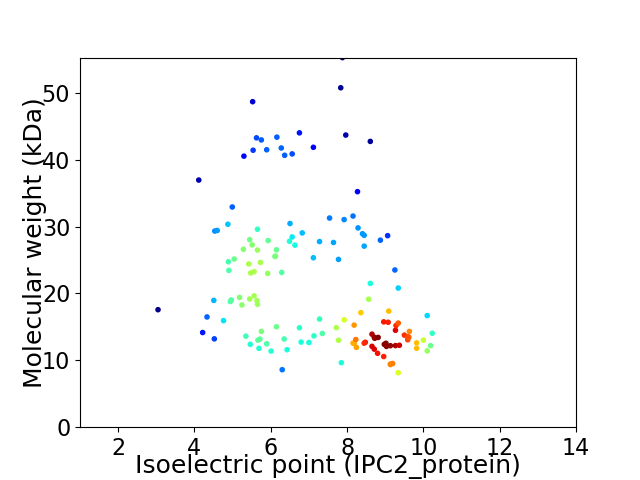
Virtual 2D-PAGE plot for 143 proteins (isoelectric point calculated using IPC2_protein)
Get csv file with sequences according to given criteria:
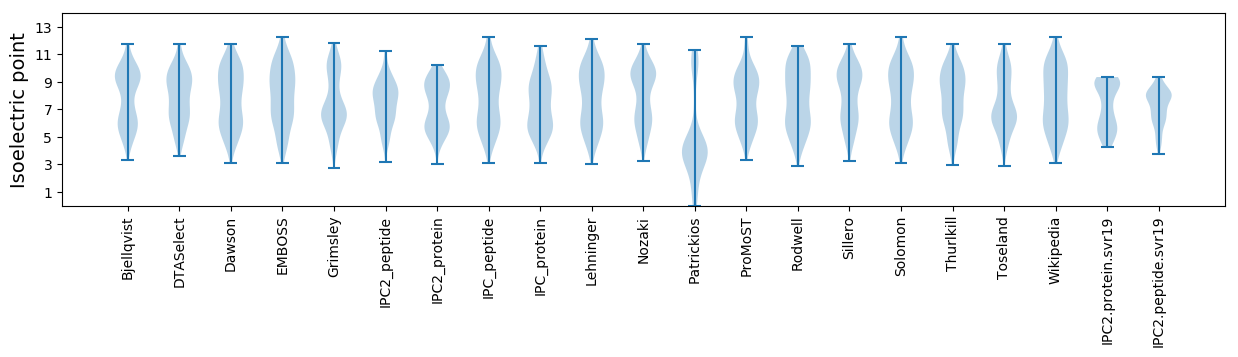
* You can choose from 21 different methods for calculating isoelectric point
Summary statistics related to proteome-wise predictions
Protein with the lowest isoelectric point:
>tr|A2Q0I1|A2Q0I1_9VIRU C17.2 OS=Hyposoter fugitivus ichnovirus OX=265522 PE=4 SV=1
MM1 pKa = 8.04PEE3 pKa = 3.76TSEE6 pKa = 4.15FTTTEE11 pKa = 4.02PSVSSDD17 pKa = 2.99SGNTSGSDD25 pKa = 3.06TKK27 pKa = 11.35QNGDD31 pKa = 3.32GDD33 pKa = 4.65FGTSTVGSEE42 pKa = 4.18NRR44 pKa = 11.84LSSYY48 pKa = 10.84GGSTSSEE55 pKa = 3.89GMPKK59 pKa = 9.69TSQSTTTEE67 pKa = 4.11LSASSDD73 pKa = 3.37SGNTSEE79 pKa = 6.41SVTEE83 pKa = 3.97QNADD87 pKa = 2.86GDD89 pKa = 4.41FRR91 pKa = 11.84TSTVGPEE98 pKa = 4.01NRR100 pKa = 11.84LSSYY104 pKa = 10.83GGSTSSEE111 pKa = 3.89GMPKK115 pKa = 9.69TSQSTTTEE123 pKa = 4.11LSASSDD129 pKa = 3.37SGNTSEE135 pKa = 6.41SVTEE139 pKa = 3.97QNADD143 pKa = 2.86GDD145 pKa = 4.41FRR147 pKa = 11.84TSTVGPEE154 pKa = 4.09DD155 pKa = 3.6RR156 pKa = 11.84LSGYY160 pKa = 9.78RR161 pKa = 11.84SSMSSKK167 pKa = 9.48STSEE171 pKa = 4.32EE172 pKa = 3.77NDD174 pKa = 3.23STTTEE179 pKa = 4.11VSTSTDD185 pKa = 3.07SEE187 pKa = 4.28NASTSDD193 pKa = 3.1TKK195 pKa = 11.03QIADD199 pKa = 3.84EE200 pKa = 4.59DD201 pKa = 4.69FGTSTVGTEE210 pKa = 4.09DD211 pKa = 3.3HH212 pKa = 6.56LSGYY216 pKa = 10.28RR217 pKa = 11.84SSTSSKK223 pKa = 10.78GMSEE227 pKa = 4.3VNASTTTEE235 pKa = 4.04LSTTTDD241 pKa = 3.18SEE243 pKa = 4.35NASTSDD249 pKa = 3.08AKK251 pKa = 11.08QNADD255 pKa = 2.88GDD257 pKa = 4.36FARR260 pKa = 11.84STVGSGDD267 pKa = 3.79HH268 pKa = 5.29SWEE271 pKa = 4.35YY272 pKa = 11.18EE273 pKa = 3.88DD274 pKa = 4.16STSSEE279 pKa = 4.27PVPEE283 pKa = 4.49LNRR286 pKa = 11.84TATTRR291 pKa = 11.84SPTSSDD297 pKa = 3.05AASAGSLFILYY308 pKa = 8.79FVVFVCFICICLSTFIPICVYY329 pKa = 10.44INKK332 pKa = 9.16KK333 pKa = 10.42RR334 pKa = 11.84NFIKK338 pKa = 10.81NSDD341 pKa = 3.69MEE343 pKa = 4.39MKK345 pKa = 9.92TPHH348 pKa = 6.17EE349 pKa = 4.48LCTT352 pKa = 3.78
MM1 pKa = 8.04PEE3 pKa = 3.76TSEE6 pKa = 4.15FTTTEE11 pKa = 4.02PSVSSDD17 pKa = 2.99SGNTSGSDD25 pKa = 3.06TKK27 pKa = 11.35QNGDD31 pKa = 3.32GDD33 pKa = 4.65FGTSTVGSEE42 pKa = 4.18NRR44 pKa = 11.84LSSYY48 pKa = 10.84GGSTSSEE55 pKa = 3.89GMPKK59 pKa = 9.69TSQSTTTEE67 pKa = 4.11LSASSDD73 pKa = 3.37SGNTSEE79 pKa = 6.41SVTEE83 pKa = 3.97QNADD87 pKa = 2.86GDD89 pKa = 4.41FRR91 pKa = 11.84TSTVGPEE98 pKa = 4.01NRR100 pKa = 11.84LSSYY104 pKa = 10.83GGSTSSEE111 pKa = 3.89GMPKK115 pKa = 9.69TSQSTTTEE123 pKa = 4.11LSASSDD129 pKa = 3.37SGNTSEE135 pKa = 6.41SVTEE139 pKa = 3.97QNADD143 pKa = 2.86GDD145 pKa = 4.41FRR147 pKa = 11.84TSTVGPEE154 pKa = 4.09DD155 pKa = 3.6RR156 pKa = 11.84LSGYY160 pKa = 9.78RR161 pKa = 11.84SSMSSKK167 pKa = 9.48STSEE171 pKa = 4.32EE172 pKa = 3.77NDD174 pKa = 3.23STTTEE179 pKa = 4.11VSTSTDD185 pKa = 3.07SEE187 pKa = 4.28NASTSDD193 pKa = 3.1TKK195 pKa = 11.03QIADD199 pKa = 3.84EE200 pKa = 4.59DD201 pKa = 4.69FGTSTVGTEE210 pKa = 4.09DD211 pKa = 3.3HH212 pKa = 6.56LSGYY216 pKa = 10.28RR217 pKa = 11.84SSTSSKK223 pKa = 10.78GMSEE227 pKa = 4.3VNASTTTEE235 pKa = 4.04LSTTTDD241 pKa = 3.18SEE243 pKa = 4.35NASTSDD249 pKa = 3.08AKK251 pKa = 11.08QNADD255 pKa = 2.88GDD257 pKa = 4.36FARR260 pKa = 11.84STVGSGDD267 pKa = 3.79HH268 pKa = 5.29SWEE271 pKa = 4.35YY272 pKa = 11.18EE273 pKa = 3.88DD274 pKa = 4.16STSSEE279 pKa = 4.27PVPEE283 pKa = 4.49LNRR286 pKa = 11.84TATTRR291 pKa = 11.84SPTSSDD297 pKa = 3.05AASAGSLFILYY308 pKa = 8.79FVVFVCFICICLSTFIPICVYY329 pKa = 10.44INKK332 pKa = 9.16KK333 pKa = 10.42RR334 pKa = 11.84NFIKK338 pKa = 10.81NSDD341 pKa = 3.69MEE343 pKa = 4.39MKK345 pKa = 9.92TPHH348 pKa = 6.17EE349 pKa = 4.48LCTT352 pKa = 3.78
Molecular weight: 36.96 kDa
Isoelectric point according different methods:
Protein with the highest isoelectric point:
>tr|A2Q0H3|A2Q0H3_9VIRU N gene-c9.1 OS=Hyposoter fugitivus ichnovirus OX=265522 PE=4 SV=1
MM1 pKa = 8.28LEE3 pKa = 3.74ISRR6 pKa = 11.84LRR8 pKa = 11.84DD9 pKa = 3.6KK10 pKa = 10.9INKK13 pKa = 8.17GRR15 pKa = 11.84PRR17 pKa = 11.84TCLSSACVDD26 pKa = 2.91IRR28 pKa = 11.84IYY30 pKa = 11.44SMSKK34 pKa = 9.47QGKK37 pKa = 6.33KK38 pKa = 7.56QRR40 pKa = 11.84NILEE44 pKa = 4.42RR45 pKa = 11.84DD46 pKa = 3.57TVSDD50 pKa = 3.69YY51 pKa = 11.61VLYY54 pKa = 10.26IIYY57 pKa = 8.46EE58 pKa = 4.0QRR60 pKa = 11.84HH61 pKa = 4.55SLRR64 pKa = 11.84RR65 pKa = 11.84VLMQKK70 pKa = 9.34GCRR73 pKa = 11.84RR74 pKa = 11.84SVRR77 pKa = 11.84LPSGTPKK84 pKa = 10.45KK85 pKa = 9.65MCRR88 pKa = 11.84QCTEE92 pKa = 4.22LLRR95 pKa = 11.84PDD97 pKa = 4.13CRR99 pKa = 11.84TSCSANLTDD108 pKa = 4.42CLSRR112 pKa = 11.84TWRR115 pKa = 11.84SRR117 pKa = 3.04
MM1 pKa = 8.28LEE3 pKa = 3.74ISRR6 pKa = 11.84LRR8 pKa = 11.84DD9 pKa = 3.6KK10 pKa = 10.9INKK13 pKa = 8.17GRR15 pKa = 11.84PRR17 pKa = 11.84TCLSSACVDD26 pKa = 2.91IRR28 pKa = 11.84IYY30 pKa = 11.44SMSKK34 pKa = 9.47QGKK37 pKa = 6.33KK38 pKa = 7.56QRR40 pKa = 11.84NILEE44 pKa = 4.42RR45 pKa = 11.84DD46 pKa = 3.57TVSDD50 pKa = 3.69YY51 pKa = 11.61VLYY54 pKa = 10.26IIYY57 pKa = 8.46EE58 pKa = 4.0QRR60 pKa = 11.84HH61 pKa = 4.55SLRR64 pKa = 11.84RR65 pKa = 11.84VLMQKK70 pKa = 9.34GCRR73 pKa = 11.84RR74 pKa = 11.84SVRR77 pKa = 11.84LPSGTPKK84 pKa = 10.45KK85 pKa = 9.65MCRR88 pKa = 11.84QCTEE92 pKa = 4.22LLRR95 pKa = 11.84PDD97 pKa = 4.13CRR99 pKa = 11.84TSCSANLTDD108 pKa = 4.42CLSRR112 pKa = 11.84TWRR115 pKa = 11.84SRR117 pKa = 3.04
Molecular weight: 13.77 kDa
Isoelectric point according different methods:
Peptides (in silico digests for buttom-up proteomics)
Below you can find in silico digests of the whole proteome with Trypsin, Chymotrypsin, Trypsin+LysC, LysN, ArgC proteases suitable for different mass spec machines.| Try ESI |
 |
|---|
| ChTry ESI |
|
|---|
| ArgC ESI |
|
|---|
| LysN ESI |
|
|---|
| TryLysC ESI |
|
|---|
| Try MALDI |
|
|---|
| ChTry MALDI |
|
|---|
| ArgC MALDI |
|
|---|
| LysN MALDI |
|
|---|
| TryLysC MALDI |
|
|---|
| Try LTQ |
|
|---|
| ChTry LTQ |
|
|---|
| ArgC LTQ |
|
|---|
| LysN LTQ |
|
|---|
| TryLysC LTQ |
|
|---|
| Try MSlow |
|
|---|
| ChTry MSlow |
|
|---|
| ArgC MSlow |
|
|---|
| LysN MSlow |
|
|---|
| TryLysC MSlow |
|
|---|
| Try MShigh |
|
|---|
| ChTry MShigh |
|
|---|
| ArgC MShigh |
|
|---|
| LysN MShigh |
|
|---|
| TryLysC MShigh |
|
|---|
General Statistics
Number of major isoforms |
Number of additional isoforms |
Number of all proteins |
Number of amino acids |
Min. Seq. Length |
Max. Seq. Length |
Avg. Seq. Length |
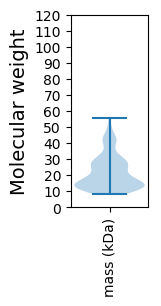
Avg. Mol. Weight |
|---|---|---|---|---|---|---|---|
0 |
26717 |
67 |
505 |
186.8 |
21.5 |
Amino acid frequency
Ala |
Cys |
Asp |
Glu |
Phe |
Gly |
His |
Ile |
Lys |
Leu |
|---|---|---|---|---|---|---|---|---|---|
5.936 ± 0.177 | 3.249 ± 0.127 |
4.649 ± 0.195 | 6.314 ± 0.301 |
5.12 ± 0.208 | 4.177 ± 0.139 |
3.526 ± 0.129 | 5.382 ± 0.197 |
4.667 ± 0.158 | 9.649 ± 0.235 |
Met |
Asn |
Gln |
Pro |
Arg |
Ser |
Thr |
Val |
Trp |
Tyr |
|---|---|---|---|---|---|---|---|---|---|
2.657 ± 0.088 | 4.409 ± 0.129 |
4.439 ± 0.173 | 3.908 ± 0.163 |
6.801 ± 0.276 | 7.939 ± 0.373 |
5.667 ± 0.264 | 6.292 ± 0.186 |
1.4 ± 0.075 | 3.818 ± 0.188 |
Most of the basic statistics you can see at this page can be downloaded from this CSV file
See this proteome in:

Proteome-pI is available under Creative Commons Attribution-NoDerivs license, for more details see here
| Reference: Kozlowski LP. Proteome-pI 2.0: Proteome Isoelectric Point Database Update. Nucleic Acids Res. 2021, doi: 10.1093/nar/gkab944 | Contact: Lukasz P. Kozlowski |