Staphylococcus lentus
Taxonomy: cellular organisms; Bacteria; Terrabacteria group; Firmicutes; Bacilli; Bacillales; Staphylococcaceae; Mammaliicoccus
Average proteome isoelectric point is 6.15
Get precalculated fractions of proteins
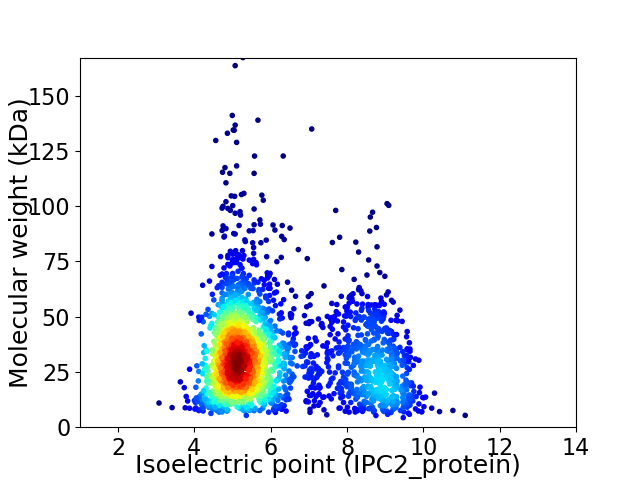
Virtual 2D-PAGE plot for 2457 proteins (isoelectric point calculated using IPC2_protein)
Get csv file with sequences according to given criteria:
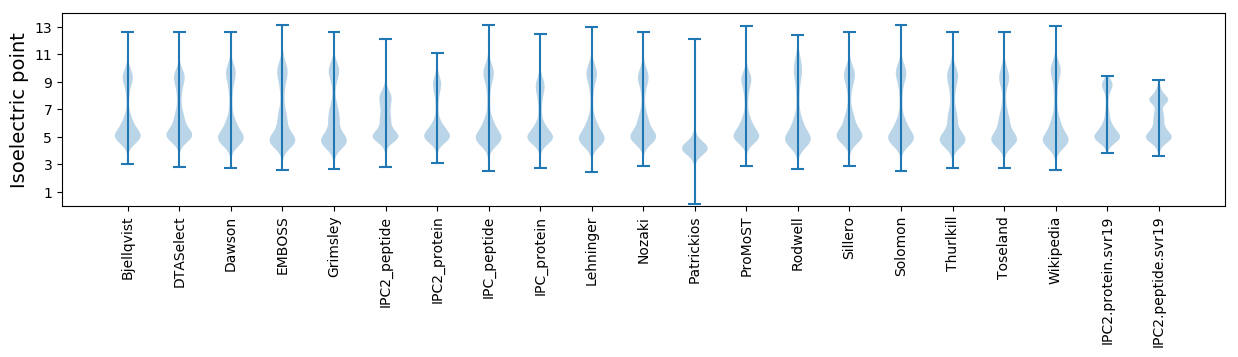
* You can choose from 21 different methods for calculating isoelectric point
Summary statistics related to proteome-wise predictions

Protein with the lowest isoelectric point:
>tr|A0A178PEJ9|A0A178PEJ9_STALE Gram_pos_anchor domain-containing protein OS=Staphylococcus lentus OX=42858 GN=AXY37_08430 PE=4 SV=1
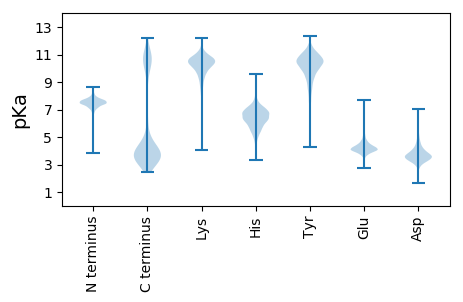
MM1 pKa = 7.37VHH3 pKa = 6.59EE4 pKa = 5.25LGTVGMVCPFPLIEE18 pKa = 4.83AQNKK22 pKa = 8.3MDD24 pKa = 4.04EE25 pKa = 4.34LQAGEE30 pKa = 4.02QLKK33 pKa = 10.22IDD35 pKa = 4.4FDD37 pKa = 4.17CTQATEE43 pKa = 4.89ALPNWAADD51 pKa = 3.18NGYY54 pKa = 9.21PVTNYY59 pKa = 9.8EE60 pKa = 4.18QVGDD64 pKa = 4.22ASWTITVEE72 pKa = 4.16KK73 pKa = 10.49QQ74 pKa = 2.69
MM1 pKa = 7.37VHH3 pKa = 6.59EE4 pKa = 5.25LGTVGMVCPFPLIEE18 pKa = 4.83AQNKK22 pKa = 8.3MDD24 pKa = 4.04EE25 pKa = 4.34LQAGEE30 pKa = 4.02QLKK33 pKa = 10.22IDD35 pKa = 4.4FDD37 pKa = 4.17CTQATEE43 pKa = 4.89ALPNWAADD51 pKa = 3.18NGYY54 pKa = 9.21PVTNYY59 pKa = 9.8EE60 pKa = 4.18QVGDD64 pKa = 4.22ASWTITVEE72 pKa = 4.16KK73 pKa = 10.49QQ74 pKa = 2.69
Molecular weight: 8.2 kDa
Isoelectric point according different methods:
Protein with the highest isoelectric point:
>tr|A0A178NE84|A0A178NE84_STALE ABC transporter ATP-binding protein OS=Staphylococcus lentus OX=42858 GN=AXY37_11420 PE=4 SV=1
MM1 pKa = 7.49VKK3 pKa = 9.1RR4 pKa = 11.84TYY6 pKa = 10.35QPNKK10 pKa = 8.16RR11 pKa = 11.84KK12 pKa = 9.54HH13 pKa = 5.99SKK15 pKa = 8.91VHH17 pKa = 5.68GFRR20 pKa = 11.84ARR22 pKa = 11.84MSSKK26 pKa = 10.48NGRR29 pKa = 11.84KK30 pKa = 8.91VLARR34 pKa = 11.84RR35 pKa = 11.84RR36 pKa = 11.84RR37 pKa = 11.84KK38 pKa = 9.05GRR40 pKa = 11.84KK41 pKa = 8.7VLSAA45 pKa = 4.05
MM1 pKa = 7.49VKK3 pKa = 9.1RR4 pKa = 11.84TYY6 pKa = 10.35QPNKK10 pKa = 8.16RR11 pKa = 11.84KK12 pKa = 9.54HH13 pKa = 5.99SKK15 pKa = 8.91VHH17 pKa = 5.68GFRR20 pKa = 11.84ARR22 pKa = 11.84MSSKK26 pKa = 10.48NGRR29 pKa = 11.84KK30 pKa = 8.91VLARR34 pKa = 11.84RR35 pKa = 11.84RR36 pKa = 11.84RR37 pKa = 11.84KK38 pKa = 9.05GRR40 pKa = 11.84KK41 pKa = 8.7VLSAA45 pKa = 4.05
Molecular weight: 5.36 kDa
Isoelectric point according different methods:
Peptides (in silico digests for buttom-up proteomics)
Below you can find in silico digests of the whole proteome with Trypsin, Chymotrypsin, Trypsin+LysC, LysN, ArgC proteases suitable for different mass spec machines.| Try ESI |
 |
|---|
| ChTry ESI |
|
|---|
| ArgC ESI |
|
|---|
| LysN ESI |
|
|---|
| TryLysC ESI |
|
|---|
| Try MALDI |
|
|---|
| ChTry MALDI |
|
|---|
| ArgC MALDI |
|
|---|
| LysN MALDI |
|
|---|
| TryLysC MALDI |
|
|---|
| Try LTQ |
|
|---|
| ChTry LTQ |
|
|---|
| ArgC LTQ |
|
|---|
| LysN LTQ |
|
|---|
| TryLysC LTQ |
|
|---|
| Try MSlow |
|
|---|
| ChTry MSlow |
|
|---|
| ArgC MSlow |
|
|---|
| LysN MSlow |
|
|---|
| TryLysC MSlow |
|
|---|
| Try MShigh |
|
|---|
| ChTry MShigh |
|
|---|
| ArgC MShigh |
|
|---|
| LysN MShigh |
|
|---|
| TryLysC MShigh |
|
|---|
General Statistics
Number of major isoforms |
Number of additional isoforms |
Number of all proteins |
Number of amino acids |
Min. Seq. Length |
Max. Seq. Length |
Avg. Seq. Length |
Avg. Mol. Weight |
|---|---|---|---|---|---|---|---|
0 |
745563 |
37 |
1497 |
303.4 |
34.27 |
Amino acid frequency
Ala |
Cys |
Asp |
Glu |
Phe |
Gly |
His |
Ile |
Lys |
Leu |
|---|---|---|---|---|---|---|---|---|---|
5.924 ± 0.049 | 0.625 ± 0.012 |
5.695 ± 0.045 | 7.459 ± 0.057 |
4.566 ± 0.037 | 6.344 ± 0.046 |
2.133 ± 0.023 | 8.997 ± 0.051 |
7.679 ± 0.053 | 9.316 ± 0.046 |
Met |
Asn |
Gln |
Pro |
Arg |
Ser |
Thr |
Val |
Trp |
Tyr |
|---|---|---|---|---|---|---|---|---|---|
2.684 ± 0.022 | 5.5 ± 0.041 |
3.213 ± 0.023 | 3.571 ± 0.035 |
3.315 ± 0.033 | 6.098 ± 0.036 |
5.468 ± 0.027 | 6.717 ± 0.039 |
0.793 ± 0.017 | 3.902 ± 0.035 |
Most of the basic statistics you can see at this page can be downloaded from this CSV file
See this proteome in:

Proteome-pI is available under Creative Commons Attribution-NoDerivs license, for more details see here
| Reference: Kozlowski LP. Proteome-pI 2.0: Proteome Isoelectric Point Database Update. Nucleic Acids Res. 2021, doi: 10.1093/nar/gkab944 | Contact: Lukasz P. Kozlowski |