Leekyejoonella antrihumi
Taxonomy: cellular organisms; Bacteria; Terrabacteria group; Actinobacteria; Actinomycetia; Micrococcales; Dermacoccaceae; Leekyejoonella
Average proteome isoelectric point is 6.46
Get precalculated fractions of proteins
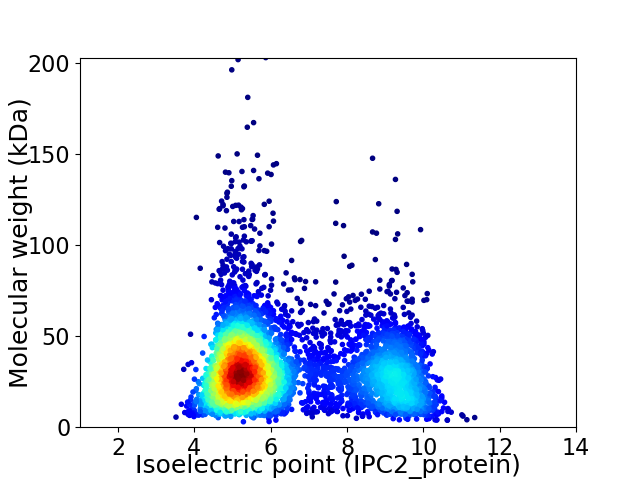
Virtual 2D-PAGE plot for 4772 proteins (isoelectric point calculated using IPC2_protein)
Get csv file with sequences according to given criteria:
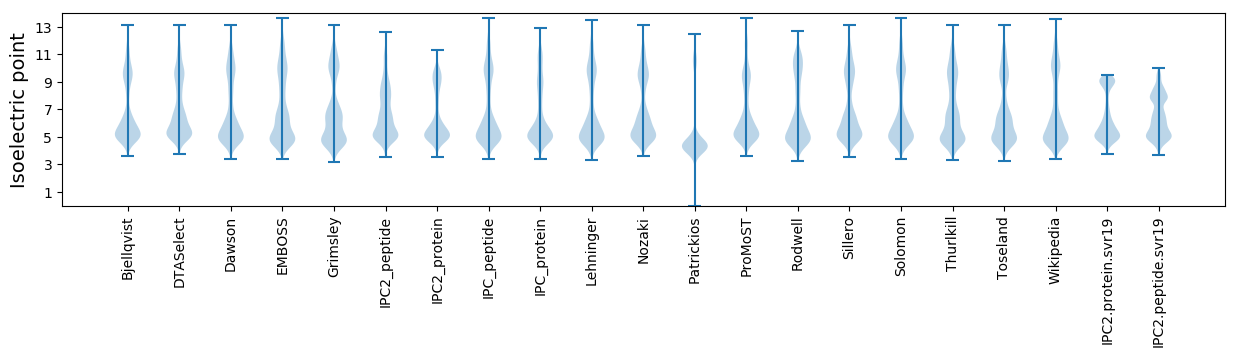
* You can choose from 21 different methods for calculating isoelectric point
Summary statistics related to proteome-wise predictions
Protein with the lowest isoelectric point:
>tr|A0A563DXG4|A0A563DXG4_9MICO FtsX-like permease family protein OS=Leekyejoonella antrihumi OX=1660198 GN=FGL98_15515 PE=4 SV=1
MM1 pKa = 7.76TDD3 pKa = 2.6WQSAFNEE10 pKa = 4.28FLSTDD15 pKa = 3.81PTDD18 pKa = 3.75VGCDD22 pKa = 2.81EE23 pKa = 4.43AMRR26 pKa = 11.84VLEE29 pKa = 4.3VYY31 pKa = 10.72VDD33 pKa = 4.17LVSTGLDD40 pKa = 3.09AAEE43 pKa = 4.43RR44 pKa = 11.84MPGVAAHH51 pKa = 6.93LKK53 pKa = 10.62ACGPCQGDD61 pKa = 3.77FTSLLDD67 pKa = 3.87AVTDD71 pKa = 4.0TPHH74 pKa = 6.39
MM1 pKa = 7.76TDD3 pKa = 2.6WQSAFNEE10 pKa = 4.28FLSTDD15 pKa = 3.81PTDD18 pKa = 3.75VGCDD22 pKa = 2.81EE23 pKa = 4.43AMRR26 pKa = 11.84VLEE29 pKa = 4.3VYY31 pKa = 10.72VDD33 pKa = 4.17LVSTGLDD40 pKa = 3.09AAEE43 pKa = 4.43RR44 pKa = 11.84MPGVAAHH51 pKa = 6.93LKK53 pKa = 10.62ACGPCQGDD61 pKa = 3.77FTSLLDD67 pKa = 3.87AVTDD71 pKa = 4.0TPHH74 pKa = 6.39
Molecular weight: 7.93 kDa
Isoelectric point according different methods:
Protein with the highest isoelectric point:
>tr|A0A563E7U0|A0A563E7U0_9MICO Uncharacterized protein OS=Leekyejoonella antrihumi OX=1660198 GN=FGL98_02375 PE=4 SV=1
MM1 pKa = 7.69SKK3 pKa = 9.0RR4 pKa = 11.84TFQPNNRR11 pKa = 11.84RR12 pKa = 11.84RR13 pKa = 11.84AKK15 pKa = 8.7THH17 pKa = 5.15GFRR20 pKa = 11.84LRR22 pKa = 11.84MRR24 pKa = 11.84TRR26 pKa = 11.84AGRR29 pKa = 11.84AVLAGRR35 pKa = 11.84RR36 pKa = 11.84RR37 pKa = 11.84KK38 pKa = 9.88GRR40 pKa = 11.84ARR42 pKa = 11.84LSAA45 pKa = 3.91
MM1 pKa = 7.69SKK3 pKa = 9.0RR4 pKa = 11.84TFQPNNRR11 pKa = 11.84RR12 pKa = 11.84RR13 pKa = 11.84AKK15 pKa = 8.7THH17 pKa = 5.15GFRR20 pKa = 11.84LRR22 pKa = 11.84MRR24 pKa = 11.84TRR26 pKa = 11.84AGRR29 pKa = 11.84AVLAGRR35 pKa = 11.84RR36 pKa = 11.84RR37 pKa = 11.84KK38 pKa = 9.88GRR40 pKa = 11.84ARR42 pKa = 11.84LSAA45 pKa = 3.91
Molecular weight: 5.31 kDa
Isoelectric point according different methods:
Peptides (in silico digests for buttom-up proteomics)
Below you can find in silico digests of the whole proteome with Trypsin, Chymotrypsin, Trypsin+LysC, LysN, ArgC proteases suitable for different mass spec machines.| Try ESI |
 |
|---|
| ChTry ESI |
|
|---|
| ArgC ESI |
|
|---|
| LysN ESI |
|
|---|
| TryLysC ESI |
|
|---|
| Try MALDI |
|
|---|
| ChTry MALDI |
|
|---|
| ArgC MALDI |
|
|---|
| LysN MALDI |
|
|---|
| TryLysC MALDI |
|
|---|
| Try LTQ |
|
|---|
| ChTry LTQ |
|
|---|
| ArgC LTQ |
|
|---|
| LysN LTQ |
|
|---|
| TryLysC LTQ |
|
|---|
| Try MSlow |
|
|---|
| ChTry MSlow |
|
|---|
| ArgC MSlow |
|
|---|
| LysN MSlow |
|
|---|
| TryLysC MSlow |
|
|---|
| Try MShigh |
|
|---|
| ChTry MShigh |
|
|---|
| ArgC MShigh |
|
|---|
| LysN MShigh |
|
|---|
| TryLysC MShigh |
|
|---|
General Statistics
Number of major isoforms |
Number of additional isoforms |
Number of all proteins |
Number of amino acids |
Min. Seq. Length |
Max. Seq. Length |
Avg. Seq. Length |
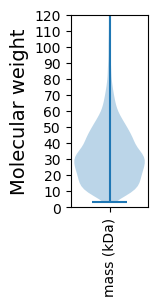
Avg. Mol. Weight |
|---|---|---|---|---|---|---|---|
0 |
1527100 |
27 |
1888 |
320.0 |
34.4 |
Amino acid frequency
Ala |
Cys |
Asp |
Glu |
Phe |
Gly |
His |
Ile |
Lys |
Leu |
|---|---|---|---|---|---|---|---|---|---|
12.492 ± 0.043 | 0.876 ± 0.009 |
6.086 ± 0.031 | 4.992 ± 0.037 |
2.802 ± 0.022 | 9.047 ± 0.03 |
2.523 ± 0.016 | 4.101 ± 0.025 |
2.124 ± 0.027 | 10.053 ± 0.041 |
Met |
Asn |
Gln |
Pro |
Arg |
Ser |
Thr |
Val |
Trp |
Tyr |
|---|---|---|---|---|---|---|---|---|---|
2.064 ± 0.014 | 1.967 ± 0.019 |
5.515 ± 0.025 | 3.351 ± 0.019 |
7.544 ± 0.04 | 5.828 ± 0.026 |
6.254 ± 0.032 | 8.775 ± 0.031 |
1.55 ± 0.015 | 2.057 ± 0.019 |
Most of the basic statistics you can see at this page can be downloaded from this CSV file
See this proteome in:

Proteome-pI is available under Creative Commons Attribution-NoDerivs license, for more details see here
| Reference: Kozlowski LP. Proteome-pI 2.0: Proteome Isoelectric Point Database Update. Nucleic Acids Res. 2021, doi: 10.1093/nar/gkab944 | Contact: Lukasz P. Kozlowski |