Escherichia phage PHB10
Taxonomy: Viruses; Duplodnaviria; Heunggongvirae; Uroviricota; Caudoviricetes; Caudovirales; Siphoviridae; unclassified Siphoviridae
Average proteome isoelectric point is 6.5
Get precalculated fractions of proteins
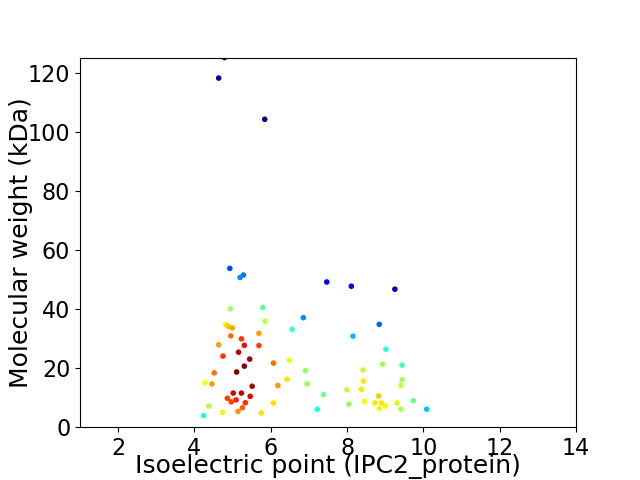
Virtual 2D-PAGE plot for 76 proteins (isoelectric point calculated using IPC2_protein)
Get csv file with sequences according to given criteria:
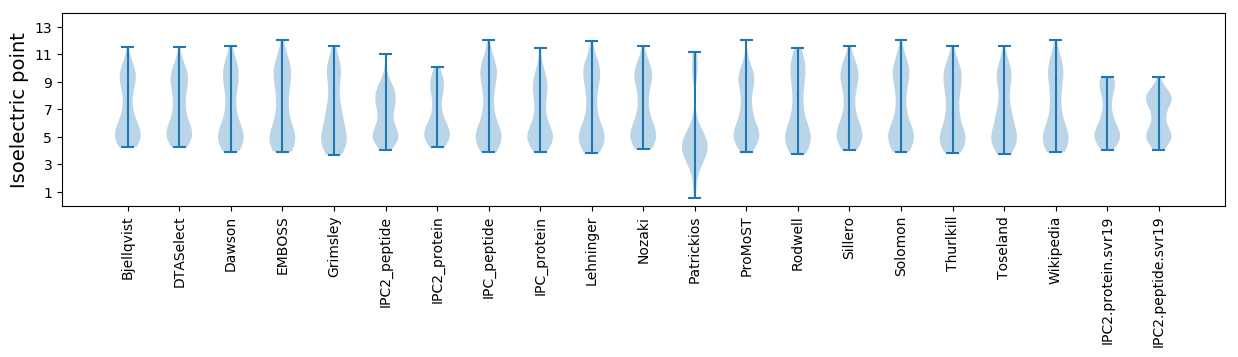
* You can choose from 21 different methods for calculating isoelectric point
Summary statistics related to proteome-wise predictions
Protein with the lowest isoelectric point:
>tr|A0A481W3S6|A0A481W3S6_9CAUD Uncharacterized protein OS=Escherichia phage PHB10 OX=2530035 PE=4 SV=1
MM1 pKa = 7.71KK2 pKa = 10.37EE3 pKa = 3.39GFYY6 pKa = 10.03WIQHH10 pKa = 5.03NGRR13 pKa = 11.84VQVAYY18 pKa = 10.05YY19 pKa = 10.68SNGVTEE25 pKa = 4.75DD26 pKa = 4.32LEE28 pKa = 4.46TGLIFNGIWHH38 pKa = 7.01LTQGDD43 pKa = 4.53DD44 pKa = 3.58ICDD47 pKa = 3.38NGEE50 pKa = 3.95AEE52 pKa = 4.69VIEE55 pKa = 5.08GPLPLPFRR63 pKa = 4.67
MM1 pKa = 7.71KK2 pKa = 10.37EE3 pKa = 3.39GFYY6 pKa = 10.03WIQHH10 pKa = 5.03NGRR13 pKa = 11.84VQVAYY18 pKa = 10.05YY19 pKa = 10.68SNGVTEE25 pKa = 4.75DD26 pKa = 4.32LEE28 pKa = 4.46TGLIFNGIWHH38 pKa = 7.01LTQGDD43 pKa = 4.53DD44 pKa = 3.58ICDD47 pKa = 3.38NGEE50 pKa = 3.95AEE52 pKa = 4.69VIEE55 pKa = 5.08GPLPLPFRR63 pKa = 4.67
Molecular weight: 7.15 kDa
Isoelectric point according different methods:
Protein with the highest isoelectric point:
>tr|A0A481W3R2|A0A481W3R2_9CAUD Uncharacterized protein OS=Escherichia phage PHB10 OX=2530035 PE=4 SV=1
MM1 pKa = 7.63RR2 pKa = 11.84LINRR6 pKa = 11.84GSKK9 pKa = 9.91QSPLARR15 pKa = 11.84QACEE19 pKa = 3.29IALAAHH25 pKa = 4.85QQRR28 pKa = 11.84YY29 pKa = 8.81GDD31 pKa = 3.75YY32 pKa = 10.25GRR34 pKa = 11.84SKK36 pKa = 10.11MKK38 pKa = 8.75EE39 pKa = 4.04TYY41 pKa = 7.6TVRR44 pKa = 11.84VDD46 pKa = 3.86GVKK49 pKa = 10.26VWVEE53 pKa = 3.75VVNCKK58 pKa = 10.32ASYY61 pKa = 10.3VATAMTGMRR70 pKa = 11.84RR71 pKa = 11.84LRR73 pKa = 11.84SLPGLANN80 pKa = 3.51
MM1 pKa = 7.63RR2 pKa = 11.84LINRR6 pKa = 11.84GSKK9 pKa = 9.91QSPLARR15 pKa = 11.84QACEE19 pKa = 3.29IALAAHH25 pKa = 4.85QQRR28 pKa = 11.84YY29 pKa = 8.81GDD31 pKa = 3.75YY32 pKa = 10.25GRR34 pKa = 11.84SKK36 pKa = 10.11MKK38 pKa = 8.75EE39 pKa = 4.04TYY41 pKa = 7.6TVRR44 pKa = 11.84VDD46 pKa = 3.86GVKK49 pKa = 10.26VWVEE53 pKa = 3.75VVNCKK58 pKa = 10.32ASYY61 pKa = 10.3VATAMTGMRR70 pKa = 11.84RR71 pKa = 11.84LRR73 pKa = 11.84SLPGLANN80 pKa = 3.51
Molecular weight: 8.96 kDa
Isoelectric point according different methods:
Peptides (in silico digests for buttom-up proteomics)
Below you can find in silico digests of the whole proteome with Trypsin, Chymotrypsin, Trypsin+LysC, LysN, ArgC proteases suitable for different mass spec machines.| Try ESI |
 |
|---|
| ChTry ESI |
|
|---|
| ArgC ESI |
|
|---|
| LysN ESI |
|
|---|
| TryLysC ESI |
|
|---|
| Try MALDI |
|
|---|
| ChTry MALDI |
|
|---|
| ArgC MALDI |
|
|---|
| LysN MALDI |
|
|---|
| TryLysC MALDI |
|
|---|
| Try LTQ |
|
|---|
| ChTry LTQ |
|
|---|
| ArgC LTQ |
|
|---|
| LysN LTQ |
|
|---|
| TryLysC LTQ |
|
|---|
| Try MSlow |
|
|---|
| ChTry MSlow |
|
|---|
| ArgC MSlow |
|
|---|
| LysN MSlow |
|
|---|
| TryLysC MSlow |
|
|---|
| Try MShigh |
|
|---|
| ChTry MShigh |
|
|---|
| ArgC MShigh |
|
|---|
| LysN MShigh |
|
|---|
| TryLysC MShigh |
|
|---|
General Statistics
Number of major isoforms |
Number of additional isoforms |
Number of all proteins |
Number of amino acids |
Min. Seq. Length |
Max. Seq. Length |
Avg. Seq. Length |
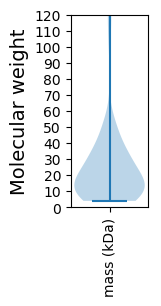
Avg. Mol. Weight |
|---|---|---|---|---|---|---|---|
0 |
16582 |
37 |
1149 |
218.2 |
24.14 |
Amino acid frequency
Ala |
Cys |
Asp |
Glu |
Phe |
Gly |
His |
Ile |
Lys |
Leu |
|---|---|---|---|---|---|---|---|---|---|
9.679 ± 0.316 | 1.176 ± 0.153 |
5.91 ± 0.207 | 6.037 ± 0.351 |
3.594 ± 0.167 | 7.478 ± 0.361 |
1.592 ± 0.166 | 5.729 ± 0.177 |
5.204 ± 0.265 | 8.636 ± 0.33 |
Met |
Asn |
Gln |
Pro |
Arg |
Ser |
Thr |
Val |
Trp |
Tyr |
|---|---|---|---|---|---|---|---|---|---|
2.418 ± 0.104 | 4.547 ± 0.193 |
4.004 ± 0.231 | 4.191 ± 0.33 |
5.693 ± 0.271 | 6.573 ± 0.229 |
6.206 ± 0.284 | 6.513 ± 0.221 |
1.55 ± 0.093 | 3.269 ± 0.143 |
Most of the basic statistics you can see at this page can be downloaded from this CSV file
See this proteome in:

Proteome-pI is available under Creative Commons Attribution-NoDerivs license, for more details see here
| Reference: Kozlowski LP. Proteome-pI 2.0: Proteome Isoelectric Point Database Update. Nucleic Acids Res. 2021, doi: 10.1093/nar/gkab944 | Contact: Lukasz P. Kozlowski |