Mycobacterium phage Terror
Taxonomy: Viruses; Duplodnaviria; Heunggongvirae; Uroviricota; Caudoviricetes; Caudovirales; Siphoviridae; Liefievirus; unclassified Liefievirus
Average proteome isoelectric point is 6.01
Get precalculated fractions of proteins
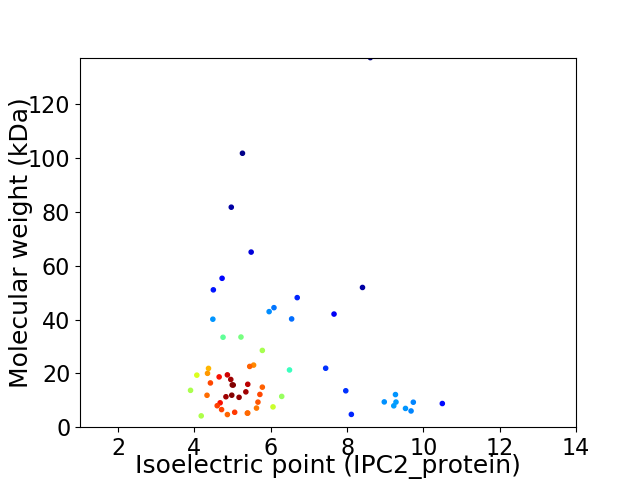
Virtual 2D-PAGE plot for 60 proteins (isoelectric point calculated using IPC2_protein)
Get csv file with sequences according to given criteria:
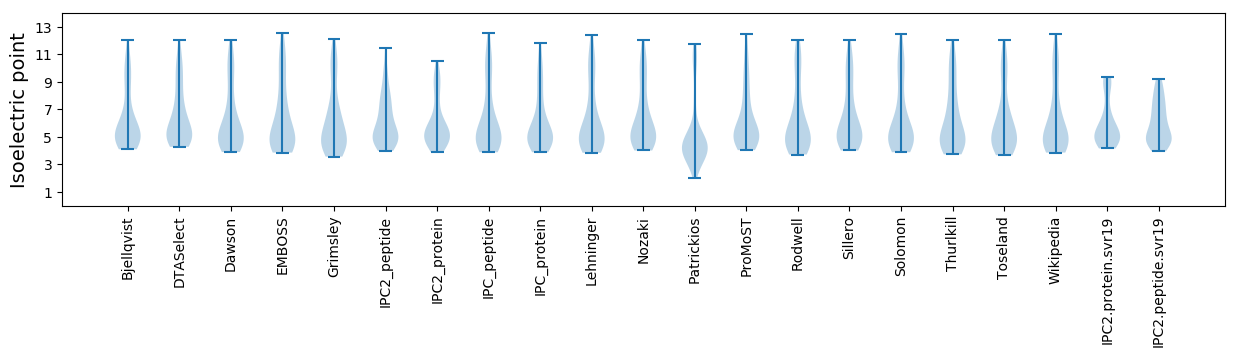
* You can choose from 21 different methods for calculating isoelectric point
Summary statistics related to proteome-wise predictions
Protein with the lowest isoelectric point:
>tr|A0A1D8EVZ3|A0A1D8EVZ3_9CAUD Uncharacterized protein OS=Mycobacterium phage Terror OX=1897550 GN=37 PE=4 SV=1
MM1 pKa = 7.85AEE3 pKa = 4.44DD4 pKa = 4.05RR5 pKa = 11.84DD6 pKa = 4.42GPMSTIDD13 pKa = 3.53AEE15 pKa = 4.44NPRR18 pKa = 11.84SGWSAEE24 pKa = 4.16CHH26 pKa = 5.86DD27 pKa = 4.05CPYY30 pKa = 10.64RR31 pKa = 11.84QLEE34 pKa = 4.29GVDD37 pKa = 3.33AA38 pKa = 5.14
MM1 pKa = 7.85AEE3 pKa = 4.44DD4 pKa = 4.05RR5 pKa = 11.84DD6 pKa = 4.42GPMSTIDD13 pKa = 3.53AEE15 pKa = 4.44NPRR18 pKa = 11.84SGWSAEE24 pKa = 4.16CHH26 pKa = 5.86DD27 pKa = 4.05CPYY30 pKa = 10.64RR31 pKa = 11.84QLEE34 pKa = 4.29GVDD37 pKa = 3.33AA38 pKa = 5.14
Molecular weight: 4.21 kDa
Isoelectric point according different methods:
Protein with the highest isoelectric point:
>tr|A0A1D8EVZ0|A0A1D8EVZ0_9CAUD Tail assembly chaperone protein OS=Mycobacterium phage Terror OX=1897550 GN=15 PE=4 SV=1
MM1 pKa = 7.29IWEE4 pKa = 5.41PILAALGGYY13 pKa = 10.12LFFAGRR19 pKa = 11.84DD20 pKa = 3.51VFRR23 pKa = 11.84SVMQSEE29 pKa = 4.4WMFGRR34 pKa = 11.84ILAADD39 pKa = 4.21LRR41 pKa = 11.84AIDD44 pKa = 3.29RR45 pKa = 11.84AQRR48 pKa = 11.84RR49 pKa = 11.84KK50 pKa = 10.45AKK52 pKa = 10.39
MM1 pKa = 7.29IWEE4 pKa = 5.41PILAALGGYY13 pKa = 10.12LFFAGRR19 pKa = 11.84DD20 pKa = 3.51VFRR23 pKa = 11.84SVMQSEE29 pKa = 4.4WMFGRR34 pKa = 11.84ILAADD39 pKa = 4.21LRR41 pKa = 11.84AIDD44 pKa = 3.29RR45 pKa = 11.84AQRR48 pKa = 11.84RR49 pKa = 11.84KK50 pKa = 10.45AKK52 pKa = 10.39
Molecular weight: 6.03 kDa
Isoelectric point according different methods:
Peptides (in silico digests for buttom-up proteomics)
Below you can find in silico digests of the whole proteome with Trypsin, Chymotrypsin, Trypsin+LysC, LysN, ArgC proteases suitable for different mass spec machines.| Try ESI |
 |
|---|
| ChTry ESI |
|
|---|
| ArgC ESI |
|
|---|
| LysN ESI |
|
|---|
| TryLysC ESI |
|
|---|
| Try MALDI |
|
|---|
| ChTry MALDI |
|
|---|
| ArgC MALDI |
|
|---|
| LysN MALDI |
|
|---|
| TryLysC MALDI |
|
|---|
| Try LTQ |
|
|---|
| ChTry LTQ |
|
|---|
| ArgC LTQ |
|
|---|
| LysN LTQ |
|
|---|
| TryLysC LTQ |
|
|---|
| Try MSlow |
|
|---|
| ChTry MSlow |
|
|---|
| ArgC MSlow |
|
|---|
| LysN MSlow |
|
|---|
| TryLysC MSlow |
|
|---|
| Try MShigh |
|
|---|
| ChTry MShigh |
|
|---|
| ArgC MShigh |
|
|---|
| LysN MShigh |
|
|---|
| TryLysC MShigh |
|
|---|
General Statistics
Number of major isoforms |
Number of additional isoforms |
Number of all proteins |
Number of amino acids |
Min. Seq. Length |
Max. Seq. Length |
Avg. Seq. Length |
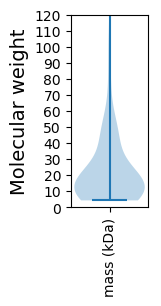
Avg. Mol. Weight |
|---|---|---|---|---|---|---|---|
0 |
13358 |
38 |
1341 |
222.6 |
23.98 |
Amino acid frequency
Ala |
Cys |
Asp |
Glu |
Phe |
Gly |
His |
Ile |
Lys |
Leu |
|---|---|---|---|---|---|---|---|---|---|
13.258 ± 0.601 | 0.853 ± 0.131 |
6.932 ± 0.302 | 5.652 ± 0.433 |
2.987 ± 0.193 | 9.215 ± 0.492 |
2.126 ± 0.238 | 4.447 ± 0.203 |
3.698 ± 0.271 | 7.546 ± 0.262 |
Met |
Asn |
Gln |
Pro |
Arg |
Ser |
Thr |
Val |
Trp |
Tyr |
|---|---|---|---|---|---|---|---|---|---|
2.163 ± 0.117 | 3.099 ± 0.2 |
6.251 ± 0.405 | 3.354 ± 0.142 |
6.738 ± 0.482 | 5.128 ± 0.353 |
5.981 ± 0.241 | 6.7 ± 0.236 |
1.961 ± 0.162 | 1.909 ± 0.147 |
Most of the basic statistics you can see at this page can be downloaded from this CSV file
See this proteome in:

Proteome-pI is available under Creative Commons Attribution-NoDerivs license, for more details see here
| Reference: Kozlowski LP. Proteome-pI 2.0: Proteome Isoelectric Point Database Update. Nucleic Acids Res. 2021, doi: 10.1093/nar/gkab944 | Contact: Lukasz P. Kozlowski |