Micromonospora echinofusca
Taxonomy: cellular organisms; Bacteria; Terrabacteria group; Actinobacteria; Actinomycetia; Micromonosporales; Micromonosporaceae; Micromonospora
Average proteome isoelectric point is 6.63
Get precalculated fractions of proteins
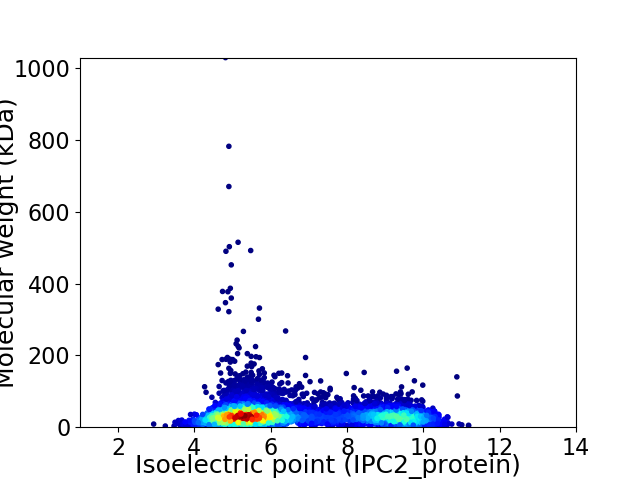
Virtual 2D-PAGE plot for 5931 proteins (isoelectric point calculated using IPC2_protein)
Get csv file with sequences according to given criteria:
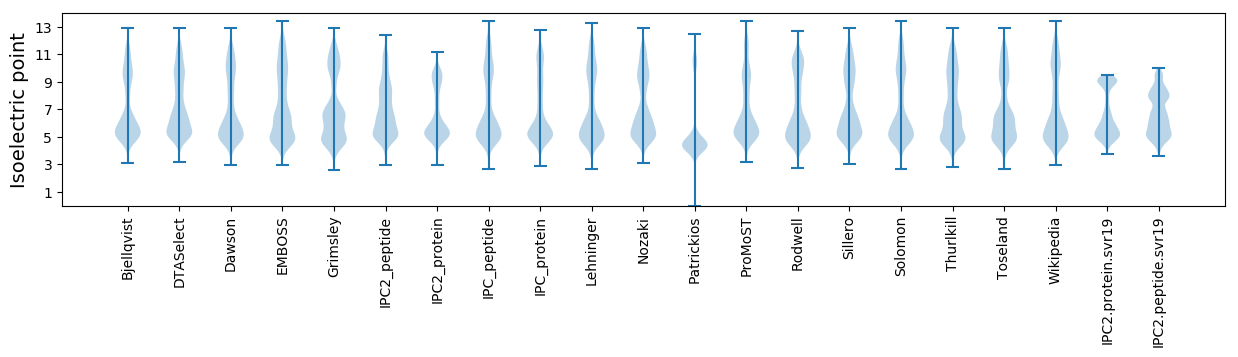
* You can choose from 21 different methods for calculating isoelectric point
Summary statistics related to proteome-wise predictions
Protein with the lowest isoelectric point:
>tr|A0A1C5GG15|A0A1C5GG15_9ACTN CDP-glycerol:poly(Glycerophosphate) glycerophosphotransferase OS=Micromonospora echinofusca OX=47858 GN=GA0070610_5091 PE=3 SV=1
MM1 pKa = 7.28ITTTYY6 pKa = 9.85QVQGMTCGHH15 pKa = 7.03CATAVSNEE23 pKa = 3.54VGAIQGVSDD32 pKa = 3.8VQVDD36 pKa = 3.87VAAGRR41 pKa = 11.84VTVTSEE47 pKa = 4.24GPLDD51 pKa = 3.76TDD53 pKa = 3.95TVRR56 pKa = 11.84SAVDD60 pKa = 2.97EE61 pKa = 4.56AGYY64 pKa = 11.01DD65 pKa = 3.52LVGAA69 pKa = 4.97
MM1 pKa = 7.28ITTTYY6 pKa = 9.85QVQGMTCGHH15 pKa = 7.03CATAVSNEE23 pKa = 3.54VGAIQGVSDD32 pKa = 3.8VQVDD36 pKa = 3.87VAAGRR41 pKa = 11.84VTVTSEE47 pKa = 4.24GPLDD51 pKa = 3.76TDD53 pKa = 3.95TVRR56 pKa = 11.84SAVDD60 pKa = 2.97EE61 pKa = 4.56AGYY64 pKa = 11.01DD65 pKa = 3.52LVGAA69 pKa = 4.97
Molecular weight: 6.99 kDa
Isoelectric point according different methods:
Protein with the highest isoelectric point:
>tr|A0A1C5G2T3|A0A1C5G2T3_9ACTN Signal transduction histidine kinase OS=Micromonospora echinofusca OX=47858 GN=GA0070610_0152 PE=4 SV=1
MM1 pKa = 7.28GSVVKK6 pKa = 10.49KK7 pKa = 9.45RR8 pKa = 11.84RR9 pKa = 11.84KK10 pKa = 9.48RR11 pKa = 11.84MAKK14 pKa = 9.41KK15 pKa = 9.87KK16 pKa = 9.7HH17 pKa = 5.84RR18 pKa = 11.84KK19 pKa = 8.7LLRR22 pKa = 11.84KK23 pKa = 7.84TRR25 pKa = 11.84VQRR28 pKa = 11.84RR29 pKa = 11.84RR30 pKa = 11.84LGKK33 pKa = 10.04
MM1 pKa = 7.28GSVVKK6 pKa = 10.49KK7 pKa = 9.45RR8 pKa = 11.84RR9 pKa = 11.84KK10 pKa = 9.48RR11 pKa = 11.84MAKK14 pKa = 9.41KK15 pKa = 9.87KK16 pKa = 9.7HH17 pKa = 5.84RR18 pKa = 11.84KK19 pKa = 8.7LLRR22 pKa = 11.84KK23 pKa = 7.84TRR25 pKa = 11.84VQRR28 pKa = 11.84RR29 pKa = 11.84RR30 pKa = 11.84LGKK33 pKa = 10.04
Molecular weight: 4.12 kDa
Isoelectric point according different methods:
Peptides (in silico digests for buttom-up proteomics)
Below you can find in silico digests of the whole proteome with Trypsin, Chymotrypsin, Trypsin+LysC, LysN, ArgC proteases suitable for different mass spec machines.| Try ESI |
 |
|---|
| ChTry ESI |
|
|---|
| ArgC ESI |
|
|---|
| LysN ESI |
|
|---|
| TryLysC ESI |
|
|---|
| Try MALDI |
|
|---|
| ChTry MALDI |
|
|---|
| ArgC MALDI |
|
|---|
| LysN MALDI |
|
|---|
| TryLysC MALDI |
|
|---|
| Try LTQ |
|
|---|
| ChTry LTQ |
|
|---|
| ArgC LTQ |
|
|---|
| LysN LTQ |
|
|---|
| TryLysC LTQ |
|
|---|
| Try MSlow |
|
|---|
| ChTry MSlow |
|
|---|
| ArgC MSlow |
|
|---|
| LysN MSlow |
|
|---|
| TryLysC MSlow |
|
|---|
| Try MShigh |
|
|---|
| ChTry MShigh |
|
|---|
| ArgC MShigh |
|
|---|
| LysN MShigh |
|
|---|
| TryLysC MShigh |
|
|---|
General Statistics
Number of major isoforms |
Number of additional isoforms |
Number of all proteins |
Number of amino acids |
Min. Seq. Length |
Max. Seq. Length |
Avg. Seq. Length |
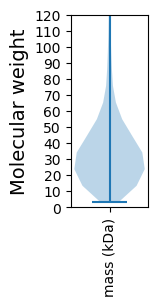
Avg. Mol. Weight |
|---|---|---|---|---|---|---|---|
0 |
2063498 |
29 |
9944 |
347.9 |
37.11 |
Amino acid frequency
Ala |
Cys |
Asp |
Glu |
Phe |
Gly |
His |
Ile |
Lys |
Leu |
|---|---|---|---|---|---|---|---|---|---|
14.404 ± 0.051 | 0.761 ± 0.009 |
6.121 ± 0.025 | 5.132 ± 0.027 |
2.596 ± 0.016 | 9.488 ± 0.03 |
2.172 ± 0.015 | 2.886 ± 0.023 |
1.555 ± 0.023 | 10.543 ± 0.041 |
Met |
Asn |
Gln |
Pro |
Arg |
Ser |
Thr |
Val |
Trp |
Tyr |
|---|---|---|---|---|---|---|---|---|---|
1.569 ± 0.011 | 1.666 ± 0.017 |
6.474 ± 0.033 | 2.626 ± 0.018 |
8.706 ± 0.04 | 4.542 ± 0.023 |
5.98 ± 0.03 | 9.218 ± 0.031 |
1.581 ± 0.013 | 1.981 ± 0.015 |
Most of the basic statistics you can see at this page can be downloaded from this CSV file
See this proteome in:

Proteome-pI is available under Creative Commons Attribution-NoDerivs license, for more details see here
| Reference: Kozlowski LP. Proteome-pI 2.0: Proteome Isoelectric Point Database Update. Nucleic Acids Res. 2021, doi: 10.1093/nar/gkab944 | Contact: Lukasz P. Kozlowski |