Human T-cell leukemia virus 2 (HTLV-2)
Taxonomy: Viruses; Riboviria; Pararnavirae; Artverviricota; Revtraviricetes; Ortervirales; Retroviridae; Orthoretrovirinae; Deltaretrovirus; Primate T-lymphotropic virus 2
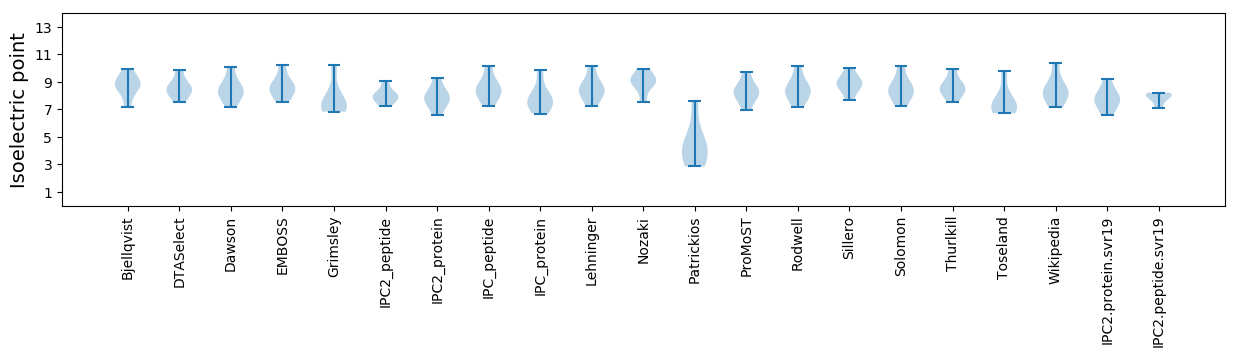
Average proteome isoelectric point is 7.79
Get precalculated fractions of proteins
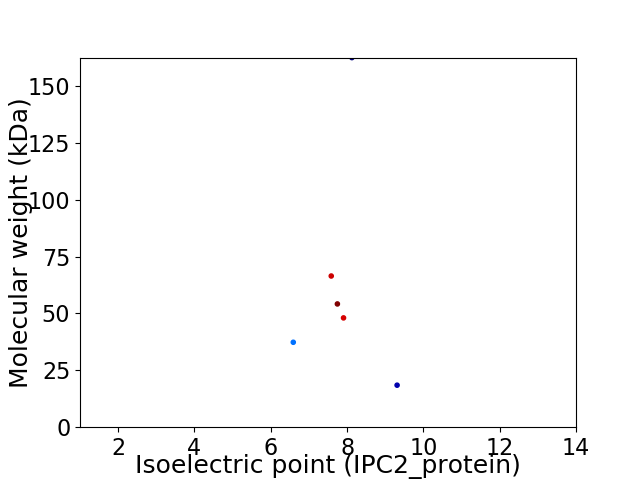
Virtual 2D-PAGE plot for 6 proteins (isoelectric point calculated using IPC2_protein)
Get csv file with sequences according to given criteria:
* You can choose from 21 different methods for calculating isoelectric point
Summary statistics related to proteome-wise predictions
Protein with the lowest isoelectric point:
>sp|Q85601|REX_HTLV2 Protein Rex OS=Human T-cell leukemia virus 2 OX=11909 PE=1 SV=1
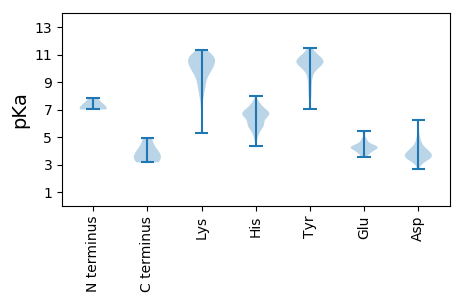
MM1 pKa = 7.36AHH3 pKa = 6.69FPGFGQSLLYY13 pKa = 10.27GYY15 pKa = 9.11PVYY18 pKa = 11.22VFGDD22 pKa = 4.2CVQADD27 pKa = 3.99WCPVSGGLCSTRR39 pKa = 11.84LHH41 pKa = 5.88RR42 pKa = 11.84HH43 pKa = 5.69ALLATCPEE51 pKa = 4.48HH52 pKa = 6.78QLTWDD57 pKa = 4.66PIDD60 pKa = 3.65GRR62 pKa = 11.84VVSSPLQYY70 pKa = 10.73LIPRR74 pKa = 11.84LPSFPTQRR82 pKa = 11.84TSRR85 pKa = 11.84TLKK88 pKa = 10.54VLTPPTTPVSPKK100 pKa = 9.78VPPAFFQSMRR110 pKa = 11.84KK111 pKa = 7.08HH112 pKa = 4.32TPYY115 pKa = 10.76RR116 pKa = 11.84NGCLEE121 pKa = 4.14PTLGDD126 pKa = 3.72QLPSLAFPEE135 pKa = 4.8PGLRR139 pKa = 11.84PQNIYY144 pKa = 7.07TTWGKK149 pKa = 7.71TVVCLYY155 pKa = 10.39LYY157 pKa = 10.27QLSPPMTWPLIPHH170 pKa = 6.93VIFCHH175 pKa = 5.62PRR177 pKa = 11.84QLGAFLTKK185 pKa = 10.45VPLKK189 pKa = 10.45RR190 pKa = 11.84LEE192 pKa = 3.93EE193 pKa = 3.98LLYY196 pKa = 11.36KK197 pKa = 10.06MFLHH201 pKa = 6.72TGTVIVLPEE210 pKa = 5.35DD211 pKa = 4.23DD212 pKa = 5.57LPTTMFQPVRR222 pKa = 11.84APCIQTAWCTGLLPYY237 pKa = 10.38HH238 pKa = 7.13SILTTPGLIWTFNDD252 pKa = 4.12GSPMISGPYY261 pKa = 8.63PKK263 pKa = 10.04AGQPSLVVQSSLLIFEE279 pKa = 4.5KK280 pKa = 10.99FEE282 pKa = 4.23TKK284 pKa = 10.32AFHH287 pKa = 6.74PSYY290 pKa = 10.61LLSHH294 pKa = 6.14QLIQYY299 pKa = 10.46SSFHH303 pKa = 6.03NLHH306 pKa = 6.67LLFDD310 pKa = 4.95EE311 pKa = 4.54YY312 pKa = 11.51TNIPVSILFNKK323 pKa = 9.99EE324 pKa = 3.52EE325 pKa = 4.57ADD327 pKa = 4.3DD328 pKa = 4.67NGDD331 pKa = 3.26
MM1 pKa = 7.36AHH3 pKa = 6.69FPGFGQSLLYY13 pKa = 10.27GYY15 pKa = 9.11PVYY18 pKa = 11.22VFGDD22 pKa = 4.2CVQADD27 pKa = 3.99WCPVSGGLCSTRR39 pKa = 11.84LHH41 pKa = 5.88RR42 pKa = 11.84HH43 pKa = 5.69ALLATCPEE51 pKa = 4.48HH52 pKa = 6.78QLTWDD57 pKa = 4.66PIDD60 pKa = 3.65GRR62 pKa = 11.84VVSSPLQYY70 pKa = 10.73LIPRR74 pKa = 11.84LPSFPTQRR82 pKa = 11.84TSRR85 pKa = 11.84TLKK88 pKa = 10.54VLTPPTTPVSPKK100 pKa = 9.78VPPAFFQSMRR110 pKa = 11.84KK111 pKa = 7.08HH112 pKa = 4.32TPYY115 pKa = 10.76RR116 pKa = 11.84NGCLEE121 pKa = 4.14PTLGDD126 pKa = 3.72QLPSLAFPEE135 pKa = 4.8PGLRR139 pKa = 11.84PQNIYY144 pKa = 7.07TTWGKK149 pKa = 7.71TVVCLYY155 pKa = 10.39LYY157 pKa = 10.27QLSPPMTWPLIPHH170 pKa = 6.93VIFCHH175 pKa = 5.62PRR177 pKa = 11.84QLGAFLTKK185 pKa = 10.45VPLKK189 pKa = 10.45RR190 pKa = 11.84LEE192 pKa = 3.93EE193 pKa = 3.98LLYY196 pKa = 11.36KK197 pKa = 10.06MFLHH201 pKa = 6.72TGTVIVLPEE210 pKa = 5.35DD211 pKa = 4.23DD212 pKa = 5.57LPTTMFQPVRR222 pKa = 11.84APCIQTAWCTGLLPYY237 pKa = 10.38HH238 pKa = 7.13SILTTPGLIWTFNDD252 pKa = 4.12GSPMISGPYY261 pKa = 8.63PKK263 pKa = 10.04AGQPSLVVQSSLLIFEE279 pKa = 4.5KK280 pKa = 10.99FEE282 pKa = 4.23TKK284 pKa = 10.32AFHH287 pKa = 6.74PSYY290 pKa = 10.61LLSHH294 pKa = 6.14QLIQYY299 pKa = 10.46SSFHH303 pKa = 6.03NLHH306 pKa = 6.67LLFDD310 pKa = 4.95EE311 pKa = 4.54YY312 pKa = 11.51TNIPVSILFNKK323 pKa = 9.99EE324 pKa = 3.52EE325 pKa = 4.57ADD327 pKa = 4.3DD328 pKa = 4.67NGDD331 pKa = 3.26
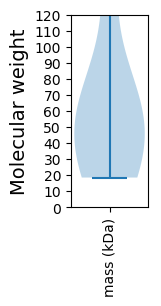
Molecular weight: 37.32 kDa
Isoelectric point according different methods:
Protein with the highest isoelectric point:
>sp|Q85601|REX_HTLV2 Protein Rex OS=Human T-cell leukemia virus 2 OX=11909 PE=1 SV=1
MM1 pKa = 7.83PKK3 pKa = 9.05TRR5 pKa = 11.84RR6 pKa = 11.84QRR8 pKa = 11.84TRR10 pKa = 11.84RR11 pKa = 11.84ARR13 pKa = 11.84RR14 pKa = 11.84NRR16 pKa = 11.84PPTPWPISQDD26 pKa = 3.28LDD28 pKa = 3.38RR29 pKa = 11.84ASYY32 pKa = 10.25MDD34 pKa = 3.74TPSTCLAIVYY44 pKa = 9.66RR45 pKa = 11.84PIGVPSQVVYY55 pKa = 10.58VPPAYY60 pKa = 9.14IDD62 pKa = 3.59MPSWPPVQSTNSPGTPSMDD81 pKa = 3.43ALSALLSNTLSLASPPSPPRR101 pKa = 11.84EE102 pKa = 3.81PQGPSRR108 pKa = 11.84SLPLPPLLSPPRR120 pKa = 11.84FHH122 pKa = 7.24LPSFNQCEE130 pKa = 4.46STPPTEE136 pKa = 3.61MDD138 pKa = 2.89AWNQPSGISSPPSPSPNLASVPKK161 pKa = 9.68TSTPPGEE168 pKa = 4.29KK169 pKa = 9.91PP170 pKa = 3.15
MM1 pKa = 7.83PKK3 pKa = 9.05TRR5 pKa = 11.84RR6 pKa = 11.84QRR8 pKa = 11.84TRR10 pKa = 11.84RR11 pKa = 11.84ARR13 pKa = 11.84RR14 pKa = 11.84NRR16 pKa = 11.84PPTPWPISQDD26 pKa = 3.28LDD28 pKa = 3.38RR29 pKa = 11.84ASYY32 pKa = 10.25MDD34 pKa = 3.74TPSTCLAIVYY44 pKa = 9.66RR45 pKa = 11.84PIGVPSQVVYY55 pKa = 10.58VPPAYY60 pKa = 9.14IDD62 pKa = 3.59MPSWPPVQSTNSPGTPSMDD81 pKa = 3.43ALSALLSNTLSLASPPSPPRR101 pKa = 11.84EE102 pKa = 3.81PQGPSRR108 pKa = 11.84SLPLPPLLSPPRR120 pKa = 11.84FHH122 pKa = 7.24LPSFNQCEE130 pKa = 4.46STPPTEE136 pKa = 3.61MDD138 pKa = 2.89AWNQPSGISSPPSPSPNLASVPKK161 pKa = 9.68TSTPPGEE168 pKa = 4.29KK169 pKa = 9.91PP170 pKa = 3.15
Molecular weight: 18.46 kDa
Isoelectric point according different methods:
Peptides (in silico digests for buttom-up proteomics)
Below you can find in silico digests of the whole proteome with Trypsin, Chymotrypsin, Trypsin+LysC, LysN, ArgC proteases suitable for different mass spec machines.| Try ESI |
 |
|---|
| ChTry ESI |
|
|---|
| ArgC ESI |
|
|---|
| LysN ESI |
|
|---|
| TryLysC ESI |
|
|---|
| Try MALDI |
|
|---|
| ChTry MALDI |
|
|---|
| ArgC MALDI |
|
|---|
| LysN MALDI |
|
|---|
| TryLysC MALDI |
|
|---|
| Try LTQ |
|
|---|
| ChTry LTQ |
|
|---|
| ArgC LTQ |
|
|---|
| LysN LTQ |
|
|---|
| TryLysC LTQ |
|
|---|
| Try MSlow |
|
|---|
| ChTry MSlow |
|
|---|
| ArgC MSlow |
|
|---|
| LysN MSlow |
|
|---|
| TryLysC MSlow |
|
|---|
| Try MShigh |
|
|---|
| ChTry MShigh |
|
|---|
| ArgC MShigh |
|
|---|
| LysN MShigh |
|
|---|
| TryLysC MShigh |
|
|---|
General Statistics
Number of major isoforms |
Number of additional isoforms |
Number of all proteins |
Number of amino acids |
Min. Seq. Length |
Max. Seq. Length |
Avg. Seq. Length |
Avg. Mol. Weight |
|---|---|---|---|---|---|---|---|
0 |
3483 |
170 |
1461 |
580.5 |
64.47 |
Amino acid frequency
Ala |
Cys |
Asp |
Glu |
Phe |
Gly |
His |
Ile |
Lys |
Leu |
|---|---|---|---|---|---|---|---|---|---|
5.713 ± 0.374 | 2.44 ± 0.203 |
3.474 ± 0.185 | 3.129 ± 0.288 |
2.9 ± 0.391 | 5.197 ± 0.253 |
3.445 ± 0.49 | 4.823 ± 0.33 |
3.704 ± 0.405 | 12.977 ± 0.589 |
Met |
Asn |
Gln |
Pro |
Arg |
Ser |
Thr |
Val |
Trp |
Tyr |
|---|---|---|---|---|---|---|---|---|---|
1.292 ± 0.217 | 3.56 ± 0.216 |
12.719 ± 1.157 | 7.063 ± 0.584 |
4.45 ± 0.408 | 7.264 ± 1.049 |
7.35 ± 0.24 | 4.077 ± 0.364 |
1.895 ± 0.159 | 2.527 ± 0.339 |
Most of the basic statistics you can see at this page can be downloaded from this CSV file
See this proteome in:

Proteome-pI is available under Creative Commons Attribution-NoDerivs license, for more details see here
| Reference: Kozlowski LP. Proteome-pI 2.0: Proteome Isoelectric Point Database Update. Nucleic Acids Res. 2021, doi: 10.1093/nar/gkab944 | Contact: Lukasz P. Kozlowski |