Alistipes sp. CAG:514
Taxonomy: cellular organisms; Bacteria; FCB group; Bacteroidetes/Chlorobi group; Bacteroidetes; Bacteroidia; Bacteroidales; Rikenellaceae; Alistipes; environmental samples
Average proteome isoelectric point is 6.29
Get precalculated fractions of proteins
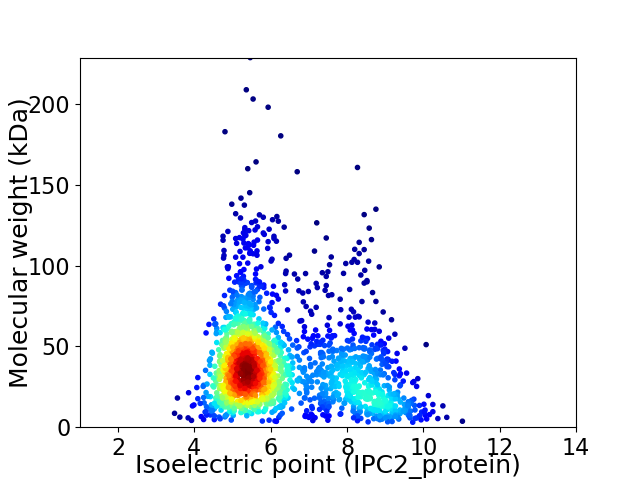
Virtual 2D-PAGE plot for 1898 proteins (isoelectric point calculated using IPC2_protein)
Get csv file with sequences according to given criteria:
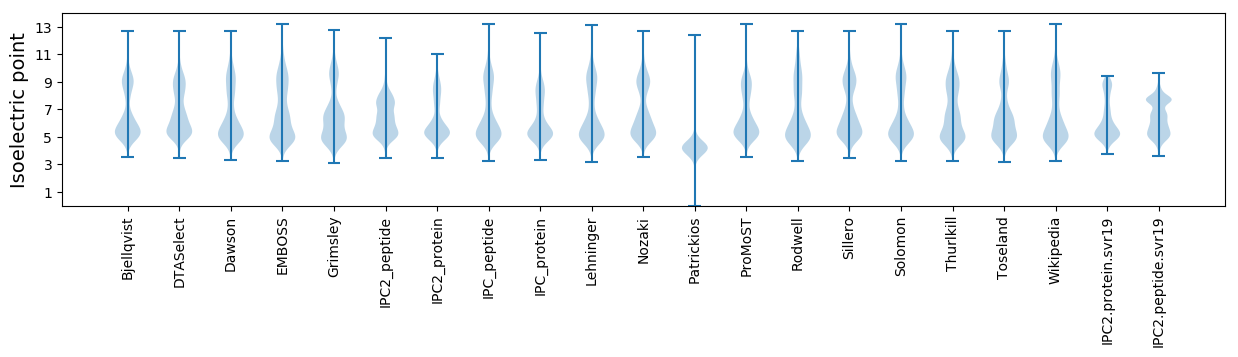
* You can choose from 21 different methods for calculating isoelectric point
Summary statistics related to proteome-wise predictions
Protein with the lowest isoelectric point:
>tr|R5B7X0|R5B7X0_9BACT TPR_REGION domain-containing protein OS=Alistipes sp. CAG:514 OX=1262696 GN=BN689_01294 PE=4 SV=1
MM1 pKa = 7.64PEE3 pKa = 4.64CYY5 pKa = 10.33VDD7 pKa = 3.41TNLIDD12 pKa = 4.12FLLDD16 pKa = 3.28KK17 pKa = 10.69QYY19 pKa = 9.99KK20 pKa = 8.56TDD22 pKa = 3.44ISEE25 pKa = 4.01LTQIFGGEE33 pKa = 3.82AQGII37 pKa = 4.07
MM1 pKa = 7.64PEE3 pKa = 4.64CYY5 pKa = 10.33VDD7 pKa = 3.41TNLIDD12 pKa = 4.12FLLDD16 pKa = 3.28KK17 pKa = 10.69QYY19 pKa = 9.99KK20 pKa = 8.56TDD22 pKa = 3.44ISEE25 pKa = 4.01LTQIFGGEE33 pKa = 3.82AQGII37 pKa = 4.07
Molecular weight: 4.21 kDa
Isoelectric point according different methods:
Protein with the highest isoelectric point:
>tr|R5BBA5|R5BBA5_9BACT Ribokinase OS=Alistipes sp. CAG:514 OX=1262696 GN=rbsK PE=3 SV=1
MM1 pKa = 7.84PSGKK5 pKa = 9.39KK6 pKa = 9.59RR7 pKa = 11.84KK8 pKa = 6.9RR9 pKa = 11.84HH10 pKa = 5.35KK11 pKa = 10.35MSTHH15 pKa = 5.04KK16 pKa = 10.3RR17 pKa = 11.84KK18 pKa = 9.87KK19 pKa = 8.77RR20 pKa = 11.84LRR22 pKa = 11.84KK23 pKa = 9.26NRR25 pKa = 11.84HH26 pKa = 4.71KK27 pKa = 10.87KK28 pKa = 9.36KK29 pKa = 10.77
MM1 pKa = 7.84PSGKK5 pKa = 9.39KK6 pKa = 9.59RR7 pKa = 11.84KK8 pKa = 6.9RR9 pKa = 11.84HH10 pKa = 5.35KK11 pKa = 10.35MSTHH15 pKa = 5.04KK16 pKa = 10.3RR17 pKa = 11.84KK18 pKa = 9.87KK19 pKa = 8.77RR20 pKa = 11.84LRR22 pKa = 11.84KK23 pKa = 9.26NRR25 pKa = 11.84HH26 pKa = 4.71KK27 pKa = 10.87KK28 pKa = 9.36KK29 pKa = 10.77
Molecular weight: 3.7 kDa
Isoelectric point according different methods:
Peptides (in silico digests for buttom-up proteomics)
Below you can find in silico digests of the whole proteome with Trypsin, Chymotrypsin, Trypsin+LysC, LysN, ArgC proteases suitable for different mass spec machines.| Try ESI |
 |
|---|
| ChTry ESI |
|
|---|
| ArgC ESI |
|
|---|
| LysN ESI |
|
|---|
| TryLysC ESI |
|
|---|
| Try MALDI |
|
|---|
| ChTry MALDI |
|
|---|
| ArgC MALDI |
|
|---|
| LysN MALDI |
|
|---|
| TryLysC MALDI |
|
|---|
| Try LTQ |
|
|---|
| ChTry LTQ |
|
|---|
| ArgC LTQ |
|
|---|
| LysN LTQ |
|
|---|
| TryLysC LTQ |
|
|---|
| Try MSlow |
|
|---|
| ChTry MSlow |
|
|---|
| ArgC MSlow |
|
|---|
| LysN MSlow |
|
|---|
| TryLysC MSlow |
|
|---|
| Try MShigh |
|
|---|
| ChTry MShigh |
|
|---|
| ArgC MShigh |
|
|---|
| LysN MShigh |
|
|---|
| TryLysC MShigh |
|
|---|
General Statistics
Number of major isoforms |
Number of additional isoforms |
Number of all proteins |
Number of amino acids |
Min. Seq. Length |
Max. Seq. Length |
Avg. Seq. Length |
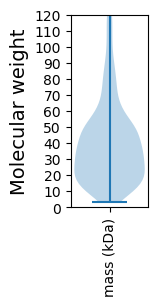
Avg. Mol. Weight |
|---|---|---|---|---|---|---|---|
0 |
700056 |
29 |
2088 |
368.8 |
41.09 |
Amino acid frequency
Ala |
Cys |
Asp |
Glu |
Phe |
Gly |
His |
Ile |
Lys |
Leu |
|---|---|---|---|---|---|---|---|---|---|
8.027 ± 0.053 | 1.279 ± 0.022 |
6.123 ± 0.04 | 6.292 ± 0.047 |
4.512 ± 0.037 | 7.712 ± 0.049 |
1.662 ± 0.02 | 6.208 ± 0.045 |
6.054 ± 0.049 | 8.701 ± 0.044 |
Met |
Asn |
Gln |
Pro |
Arg |
Ser |
Thr |
Val |
Trp |
Tyr |
|---|---|---|---|---|---|---|---|---|---|
2.678 ± 0.024 | 4.278 ± 0.04 |
3.94 ± 0.028 | 2.716 ± 0.025 |
5.286 ± 0.04 | 6.737 ± 0.053 |
5.423 ± 0.039 | 7.125 ± 0.044 |
1.254 ± 0.022 | 3.991 ± 0.035 |
Most of the basic statistics you can see at this page can be downloaded from this CSV file
See this proteome in:

Proteome-pI is available under Creative Commons Attribution-NoDerivs license, for more details see here
| Reference: Kozlowski LP. Proteome-pI 2.0: Proteome Isoelectric Point Database Update. Nucleic Acids Res. 2021, doi: 10.1093/nar/gkab944 | Contact: Lukasz P. Kozlowski |