Spiroplasma mirum ATCC 29335
Taxonomy: cellular organisms; Bacteria; Terrabacteria group; Tenericutes; Mollicutes; Entomoplasmatales; Spiroplasmataceae; Spiroplasma; Spiroplasma mirum
Average proteome isoelectric point is 7.11
Get precalculated fractions of proteins
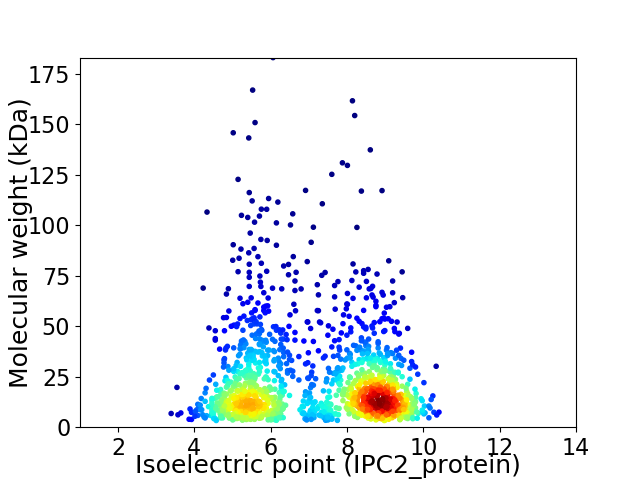
Virtual 2D-PAGE plot for 1384 proteins (isoelectric point calculated using IPC2_protein)
Get csv file with sequences according to given criteria:
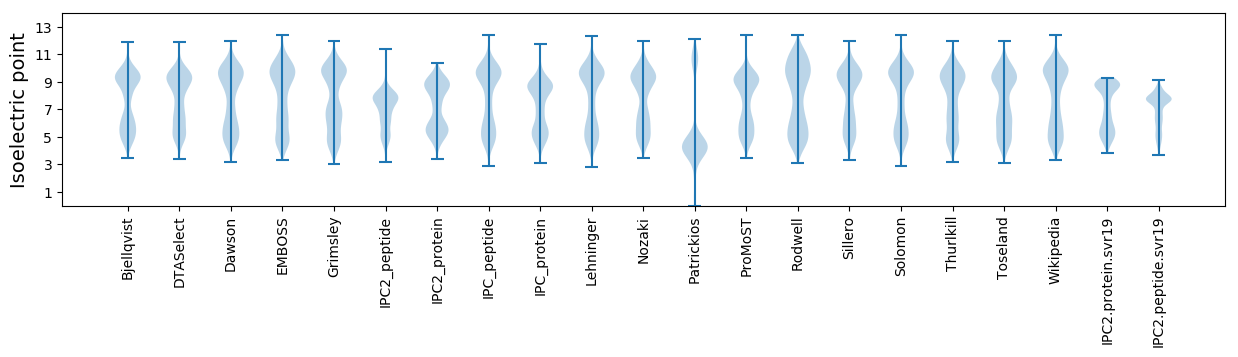
* You can choose from 21 different methods for calculating isoelectric point
Summary statistics related to proteome-wise predictions
Protein with the lowest isoelectric point:
>tr|W0GPX9|W0GPX9_9MOLU Uncharacterized protein OS=Spiroplasma mirum ATCC 29335 OX=838561 GN=P344_04315 PE=4 SV=1
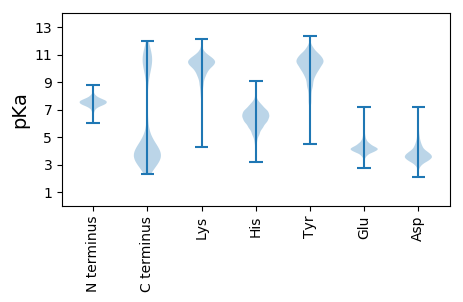
MM1 pKa = 8.04DD2 pKa = 4.6YY3 pKa = 10.66DD4 pKa = 3.51YY5 pKa = 11.49SYY7 pKa = 11.86AFKK10 pKa = 10.56TRR12 pKa = 11.84DD13 pKa = 3.35TNKK16 pKa = 10.46ANLQSFTLLFALSDD30 pKa = 3.45SDD32 pKa = 5.37NYY34 pKa = 10.81VSYY37 pKa = 11.67NDD39 pKa = 3.81LQDD42 pKa = 3.64NVFSFPTLSIGGDD55 pKa = 3.25DD56 pKa = 4.49SAFCEE61 pKa = 4.36LL62 pKa = 4.44
MM1 pKa = 8.04DD2 pKa = 4.6YY3 pKa = 10.66DD4 pKa = 3.51YY5 pKa = 11.49SYY7 pKa = 11.86AFKK10 pKa = 10.56TRR12 pKa = 11.84DD13 pKa = 3.35TNKK16 pKa = 10.46ANLQSFTLLFALSDD30 pKa = 3.45SDD32 pKa = 5.37NYY34 pKa = 10.81VSYY37 pKa = 11.67NDD39 pKa = 3.81LQDD42 pKa = 3.64NVFSFPTLSIGGDD55 pKa = 3.25DD56 pKa = 4.49SAFCEE61 pKa = 4.36LL62 pKa = 4.44
Molecular weight: 7.06 kDa
Isoelectric point according different methods:
Protein with the highest isoelectric point:
>tr|W0GNZ7|W0GNZ7_9MOLU Uncharacterized protein OS=Spiroplasma mirum ATCC 29335 OX=838561 GN=P344_02010 PE=4 SV=1
MM1 pKa = 7.61AKK3 pKa = 10.14KK4 pKa = 10.19SLKK7 pKa = 10.04VKK9 pKa = 8.54QARR12 pKa = 11.84HH13 pKa = 5.62PKK15 pKa = 9.52FKK17 pKa = 10.49VRR19 pKa = 11.84GYY21 pKa = 7.69TRR23 pKa = 11.84CGNCGRR29 pKa = 11.84PHH31 pKa = 6.52AVLRR35 pKa = 11.84KK36 pKa = 9.43YY37 pKa = 10.28NLCRR41 pKa = 11.84LCFRR45 pKa = 11.84DD46 pKa = 3.97LAYY49 pKa = 9.88KK50 pKa = 10.15GQIPGVRR57 pKa = 11.84KK58 pKa = 10.13ASWW61 pKa = 2.78
MM1 pKa = 7.61AKK3 pKa = 10.14KK4 pKa = 10.19SLKK7 pKa = 10.04VKK9 pKa = 8.54QARR12 pKa = 11.84HH13 pKa = 5.62PKK15 pKa = 9.52FKK17 pKa = 10.49VRR19 pKa = 11.84GYY21 pKa = 7.69TRR23 pKa = 11.84CGNCGRR29 pKa = 11.84PHH31 pKa = 6.52AVLRR35 pKa = 11.84KK36 pKa = 9.43YY37 pKa = 10.28NLCRR41 pKa = 11.84LCFRR45 pKa = 11.84DD46 pKa = 3.97LAYY49 pKa = 9.88KK50 pKa = 10.15GQIPGVRR57 pKa = 11.84KK58 pKa = 10.13ASWW61 pKa = 2.78
Molecular weight: 7.09 kDa
Isoelectric point according different methods:
Peptides (in silico digests for buttom-up proteomics)
Below you can find in silico digests of the whole proteome with Trypsin, Chymotrypsin, Trypsin+LysC, LysN, ArgC proteases suitable for different mass spec machines.| Try ESI |
 |
|---|
| ChTry ESI |
|
|---|
| ArgC ESI |
|
|---|
| LysN ESI |
|
|---|
| TryLysC ESI |
|
|---|
| Try MALDI |
|
|---|
| ChTry MALDI |
|
|---|
| ArgC MALDI |
|
|---|
| LysN MALDI |
|
|---|
| TryLysC MALDI |
|
|---|
| Try LTQ |
|
|---|
| ChTry LTQ |
|
|---|
| ArgC LTQ |
|
|---|
| LysN LTQ |
|
|---|
| TryLysC LTQ |
|
|---|
| Try MSlow |
|
|---|
| ChTry MSlow |
|
|---|
| ArgC MSlow |
|
|---|
| LysN MSlow |
|
|---|
| TryLysC MSlow |
|
|---|
| Try MShigh |
|
|---|
| ChTry MShigh |
|
|---|
| ArgC MShigh |
|
|---|
| LysN MShigh |
|
|---|
| TryLysC MShigh |
|
|---|
General Statistics
Number of major isoforms |
Number of additional isoforms |
Number of all proteins |
Number of amino acids |
Min. Seq. Length |
Max. Seq. Length |
Avg. Seq. Length |
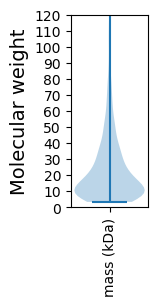
Avg. Mol. Weight |
|---|---|---|---|---|---|---|---|
0 |
305154 |
29 |
1566 |
220.5 |
25.18 |
Amino acid frequency
Ala |
Cys |
Asp |
Glu |
Phe |
Gly |
His |
Ile |
Lys |
Leu |
|---|---|---|---|---|---|---|---|---|---|
5.629 ± 0.073 | 0.82 ± 0.023 |
5.12 ± 0.053 | 5.654 ± 0.088 |
4.93 ± 0.068 | 5.115 ± 0.069 |
1.799 ± 0.034 | 9.703 ± 0.076 |
8.539 ± 0.079 | 10.113 ± 0.08 |
Met |
Asn |
Gln |
Pro |
Arg |
Ser |
Thr |
Val |
Trp |
Tyr |
|---|---|---|---|---|---|---|---|---|---|
2.271 ± 0.029 | 7.413 ± 0.091 |
3.176 ± 0.05 | 3.979 ± 0.043 |
2.961 ± 0.048 | 5.523 ± 0.049 |
5.694 ± 0.054 | 6.06 ± 0.059 |
1.172 ± 0.031 | 4.327 ± 0.061 |
Most of the basic statistics you can see at this page can be downloaded from this CSV file
See this proteome in:

Proteome-pI is available under Creative Commons Attribution-NoDerivs license, for more details see here
| Reference: Kozlowski LP. Proteome-pI 2.0: Proteome Isoelectric Point Database Update. Nucleic Acids Res. 2021, doi: 10.1093/nar/gkab944 | Contact: Lukasz P. Kozlowski |