Streptococcus phage IPP38
Taxonomy: Viruses; Duplodnaviria; Heunggongvirae; Uroviricota; Caudoviricetes; Caudovirales; Siphoviridae; unclassified Siphoviridae
Average proteome isoelectric point is 6.25
Get precalculated fractions of proteins
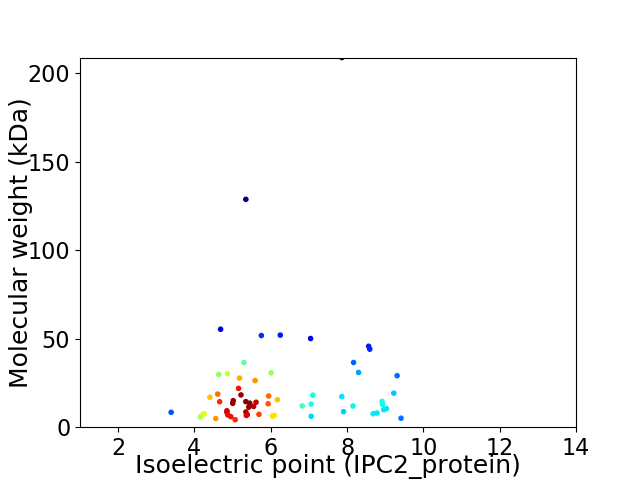
Virtual 2D-PAGE plot for 63 proteins (isoelectric point calculated using IPC2_protein)
Get csv file with sequences according to given criteria:
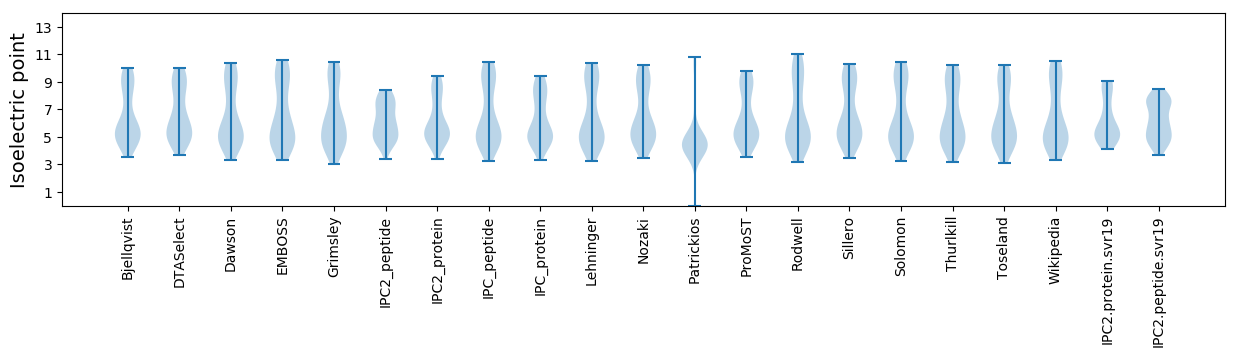
* You can choose from 21 different methods for calculating isoelectric point
Summary statistics related to proteome-wise predictions
Protein with the lowest isoelectric point:
>tr|A0A1S5SC28|A0A1S5SC28_9CAUD Uncharacterized protein OS=Streptococcus phage IPP38 OX=1916177 GN=IPP38_00025 PE=4 SV=1
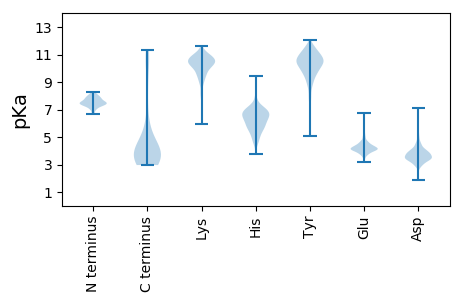
MM1 pKa = 7.91AILDD5 pKa = 4.57DD6 pKa = 4.75LQALYY11 pKa = 11.25DD12 pKa = 4.06NGWDD16 pKa = 4.07ASFNYY21 pKa = 9.53NGQVCGIFPNSIYY34 pKa = 10.86DD35 pKa = 3.58VVVIIADD42 pKa = 3.53DD43 pKa = 4.13EE44 pKa = 4.47YY45 pKa = 10.96RR46 pKa = 11.84ASSFDD51 pKa = 4.4DD52 pKa = 4.95LISLQIEE59 pKa = 4.74GKK61 pKa = 7.71TLPEE65 pKa = 3.62IMNEE69 pKa = 3.98VEE71 pKa = 4.11VQYY74 pKa = 11.6GG75 pKa = 3.21
MM1 pKa = 7.91AILDD5 pKa = 4.57DD6 pKa = 4.75LQALYY11 pKa = 11.25DD12 pKa = 4.06NGWDD16 pKa = 4.07ASFNYY21 pKa = 9.53NGQVCGIFPNSIYY34 pKa = 10.86DD35 pKa = 3.58VVVIIADD42 pKa = 3.53DD43 pKa = 4.13EE44 pKa = 4.47YY45 pKa = 10.96RR46 pKa = 11.84ASSFDD51 pKa = 4.4DD52 pKa = 4.95LISLQIEE59 pKa = 4.74GKK61 pKa = 7.71TLPEE65 pKa = 3.62IMNEE69 pKa = 3.98VEE71 pKa = 4.11VQYY74 pKa = 11.6GG75 pKa = 3.21
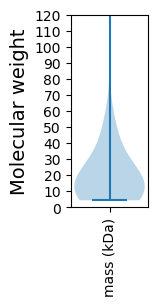
Molecular weight: 8.43 kDa
Isoelectric point according different methods:
Protein with the highest isoelectric point:
>tr|A0A1S5SBY4|A0A1S5SBY4_9CAUD CI-like repressor OS=Streptococcus phage IPP38 OX=1916177 GN=IPP38_00003 PE=4 SV=1
MM1 pKa = 7.81RR2 pKa = 11.84PRR4 pKa = 11.84RR5 pKa = 11.84YY6 pKa = 9.18PYY8 pKa = 10.05SGKK11 pKa = 10.15KK12 pKa = 9.81EE13 pKa = 4.19STFVKK18 pKa = 10.4ADD20 pKa = 3.56PEE22 pKa = 4.22LMLNINKK29 pKa = 9.29IDD31 pKa = 3.66VGNIQAKK38 pKa = 10.48NIFGKK43 pKa = 10.24II44 pKa = 3.35
MM1 pKa = 7.81RR2 pKa = 11.84PRR4 pKa = 11.84RR5 pKa = 11.84YY6 pKa = 9.18PYY8 pKa = 10.05SGKK11 pKa = 10.15KK12 pKa = 9.81EE13 pKa = 4.19STFVKK18 pKa = 10.4ADD20 pKa = 3.56PEE22 pKa = 4.22LMLNINKK29 pKa = 9.29IDD31 pKa = 3.66VGNIQAKK38 pKa = 10.48NIFGKK43 pKa = 10.24II44 pKa = 3.35
Molecular weight: 5.08 kDa
Isoelectric point according different methods:
Peptides (in silico digests for buttom-up proteomics)
Below you can find in silico digests of the whole proteome with Trypsin, Chymotrypsin, Trypsin+LysC, LysN, ArgC proteases suitable for different mass spec machines.| Try ESI |
 |
|---|
| ChTry ESI |
|
|---|
| ArgC ESI |
|
|---|
| LysN ESI |
|
|---|
| TryLysC ESI |
|
|---|
| Try MALDI |
|
|---|
| ChTry MALDI |
|
|---|
| ArgC MALDI |
|
|---|
| LysN MALDI |
|
|---|
| TryLysC MALDI |
|
|---|
| Try LTQ |
|
|---|
| ChTry LTQ |
|
|---|
| ArgC LTQ |
|
|---|
| LysN LTQ |
|
|---|
| TryLysC LTQ |
|
|---|
| Try MSlow |
|
|---|
| ChTry MSlow |
|
|---|
| ArgC MSlow |
|
|---|
| LysN MSlow |
|
|---|
| TryLysC MSlow |
|
|---|
| Try MShigh |
|
|---|
| ChTry MShigh |
|
|---|
| ArgC MShigh |
|
|---|
| LysN MShigh |
|
|---|
| TryLysC MShigh |
|
|---|
General Statistics
Number of major isoforms |
Number of additional isoforms |
Number of all proteins |
Number of amino acids |
Min. Seq. Length |
Max. Seq. Length |
Avg. Seq. Length |
Avg. Mol. Weight |
|---|---|---|---|---|---|---|---|
0 |
12612 |
35 |
1871 |
200.2 |
22.73 |
Amino acid frequency
Ala |
Cys |
Asp |
Glu |
Phe |
Gly |
His |
Ile |
Lys |
Leu |
|---|---|---|---|---|---|---|---|---|---|
6.843 ± 0.546 | 0.539 ± 0.101 |
6.224 ± 0.3 | 8.08 ± 0.456 |
4.004 ± 0.259 | 6.304 ± 0.525 |
1.522 ± 0.176 | 6.787 ± 0.315 |
8.722 ± 0.367 | 8.262 ± 0.259 |
Met |
Asn |
Gln |
Pro |
Arg |
Ser |
Thr |
Val |
Trp |
Tyr |
|---|---|---|---|---|---|---|---|---|---|
2.45 ± 0.226 | 5.249 ± 0.311 |
2.743 ± 0.263 | 3.972 ± 0.197 |
4.567 ± 0.359 | 6.137 ± 0.327 |
6.129 ± 0.371 | 6.28 ± 0.208 |
1.356 ± 0.153 | 3.83 ± 0.349 |
Most of the basic statistics you can see at this page can be downloaded from this CSV file
See this proteome in:

Proteome-pI is available under Creative Commons Attribution-NoDerivs license, for more details see here
| Reference: Kozlowski LP. Proteome-pI 2.0: Proteome Isoelectric Point Database Update. Nucleic Acids Res. 2021, doi: 10.1093/nar/gkab944 | Contact: Lukasz P. Kozlowski |