Dickeya phage Sucellus
Taxonomy: Viruses; Duplodnaviria; Heunggongvirae; Uroviricota; Caudoviricetes; Caudovirales; Siphoviridae; unclassified Siphoviridae
Average proteome isoelectric point is 6.51
Get precalculated fractions of proteins
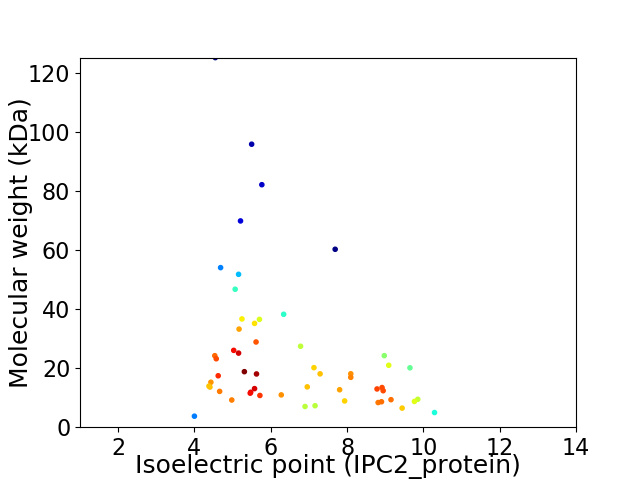
Virtual 2D-PAGE plot for 55 proteins (isoelectric point calculated using IPC2_protein)
Get csv file with sequences according to given criteria:
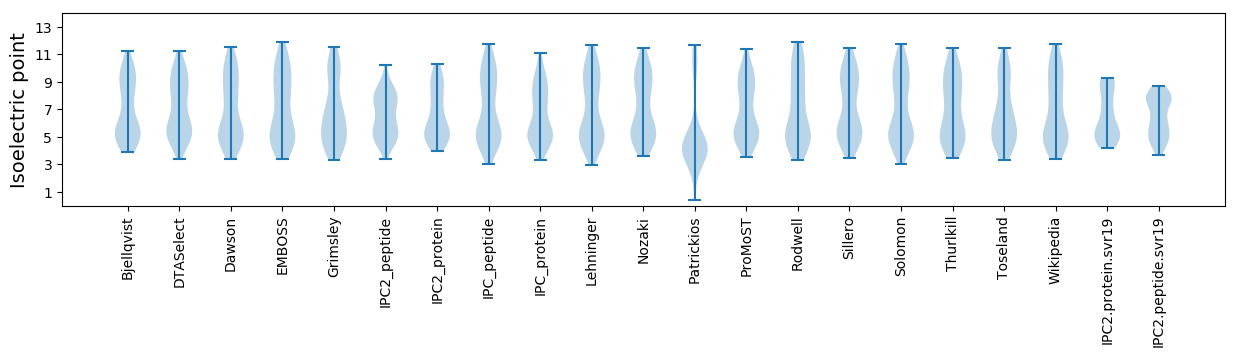
* You can choose from 21 different methods for calculating isoelectric point
Summary statistics related to proteome-wise predictions
Protein with the lowest isoelectric point:
>tr|A0A2S1GLI1|A0A2S1GLI1_9CAUD Uncharacterized protein OS=Dickeya phage Sucellus OX=2163632 PE=4 SV=1
MM1 pKa = 7.23EE2 pKa = 4.6VNMFEE7 pKa = 5.19LVQCVSIVAIVVMFAALLIAAVSEE31 pKa = 4.89FIEE34 pKa = 4.28
MM1 pKa = 7.23EE2 pKa = 4.6VNMFEE7 pKa = 5.19LVQCVSIVAIVVMFAALLIAAVSEE31 pKa = 4.89FIEE34 pKa = 4.28
Molecular weight: 3.73 kDa
Isoelectric point according different methods:
Protein with the highest isoelectric point:
>tr|A0A2S1GLD8|A0A2S1GLD8_9CAUD Uncharacterized protein OS=Dickeya phage Sucellus OX=2163632 PE=4 SV=1
MM1 pKa = 7.48KK2 pKa = 10.55GKK4 pKa = 8.54LTNVSGISIQTKK16 pKa = 10.15NSIIDD21 pKa = 3.07ICEE24 pKa = 3.74AKK26 pKa = 10.15FANSTTWPANLSGASGFYY44 pKa = 10.96AMYY47 pKa = 11.06AEE49 pKa = 5.5FYY51 pKa = 10.07NHH53 pKa = 5.68NTVVDD58 pKa = 4.56SILYY62 pKa = 9.12LGPVKK67 pKa = 9.49PTARR71 pKa = 11.84QIRR74 pKa = 11.84RR75 pKa = 11.84MKK77 pKa = 9.99RR78 pKa = 11.84RR79 pKa = 11.84LRR81 pKa = 11.84RR82 pKa = 11.84GQQ84 pKa = 3.09
MM1 pKa = 7.48KK2 pKa = 10.55GKK4 pKa = 8.54LTNVSGISIQTKK16 pKa = 10.15NSIIDD21 pKa = 3.07ICEE24 pKa = 3.74AKK26 pKa = 10.15FANSTTWPANLSGASGFYY44 pKa = 10.96AMYY47 pKa = 11.06AEE49 pKa = 5.5FYY51 pKa = 10.07NHH53 pKa = 5.68NTVVDD58 pKa = 4.56SILYY62 pKa = 9.12LGPVKK67 pKa = 9.49PTARR71 pKa = 11.84QIRR74 pKa = 11.84RR75 pKa = 11.84MKK77 pKa = 9.99RR78 pKa = 11.84RR79 pKa = 11.84LRR81 pKa = 11.84RR82 pKa = 11.84GQQ84 pKa = 3.09
Molecular weight: 9.45 kDa
Isoelectric point according different methods:
Peptides (in silico digests for buttom-up proteomics)
Below you can find in silico digests of the whole proteome with Trypsin, Chymotrypsin, Trypsin+LysC, LysN, ArgC proteases suitable for different mass spec machines.| Try ESI |
 |
|---|
| ChTry ESI |
|
|---|
| ArgC ESI |
|
|---|
| LysN ESI |
|
|---|
| TryLysC ESI |
|
|---|
| Try MALDI |
|
|---|
| ChTry MALDI |
|
|---|
| ArgC MALDI |
|
|---|
| LysN MALDI |
|
|---|
| TryLysC MALDI |
|
|---|
| Try LTQ |
|
|---|
| ChTry LTQ |
|
|---|
| ArgC LTQ |
|
|---|
| LysN LTQ |
|
|---|
| TryLysC LTQ |
|
|---|
| Try MSlow |
|
|---|
| ChTry MSlow |
|
|---|
| ArgC MSlow |
|
|---|
| LysN MSlow |
|
|---|
| TryLysC MSlow |
|
|---|
| Try MShigh |
|
|---|
| ChTry MShigh |
|
|---|
| ArgC MShigh |
|
|---|
| LysN MShigh |
|
|---|
| TryLysC MShigh |
|
|---|
General Statistics
Number of major isoforms |
Number of additional isoforms |
Number of all proteins |
Number of amino acids |
Min. Seq. Length |
Max. Seq. Length |
Avg. Seq. Length |
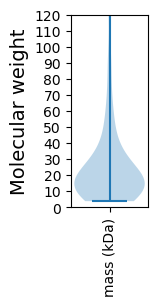
Avg. Mol. Weight |
|---|---|---|---|---|---|---|---|
0 |
12415 |
34 |
1135 |
225.7 |
25.15 |
Amino acid frequency
Ala |
Cys |
Asp |
Glu |
Phe |
Gly |
His |
Ile |
Lys |
Leu |
|---|---|---|---|---|---|---|---|---|---|
6.839 ± 0.397 | 1.474 ± 0.216 |
5.928 ± 0.216 | 6.242 ± 0.222 |
4.108 ± 0.245 | 7.628 ± 0.35 |
1.482 ± 0.174 | 7.652 ± 0.303 |
6.75 ± 0.363 | 6.83 ± 0.19 |
Met |
Asn |
Gln |
Pro |
Arg |
Ser |
Thr |
Val |
Trp |
Tyr |
|---|---|---|---|---|---|---|---|---|---|
2.996 ± 0.173 | 6.307 ± 0.436 |
3.182 ± 0.273 | 3.335 ± 0.438 |
4.503 ± 0.245 | 8.055 ± 0.346 |
5.356 ± 0.382 | 6.444 ± 0.294 |
1.16 ± 0.092 | 3.729 ± 0.204 |
Most of the basic statistics you can see at this page can be downloaded from this CSV file
See this proteome in:

Proteome-pI is available under Creative Commons Attribution-NoDerivs license, for more details see here
| Reference: Kozlowski LP. Proteome-pI 2.0: Proteome Isoelectric Point Database Update. Nucleic Acids Res. 2021, doi: 10.1093/nar/gkab944 | Contact: Lukasz P. Kozlowski |