Enterococcus phage phiFL3A
Taxonomy: Viruses; Duplodnaviria; Heunggongvirae; Uroviricota; Caudoviricetes; Caudovirales; Siphoviridae; Phifelvirus; Enterococcus virus FL3
Average proteome isoelectric point is 6.37
Get precalculated fractions of proteins
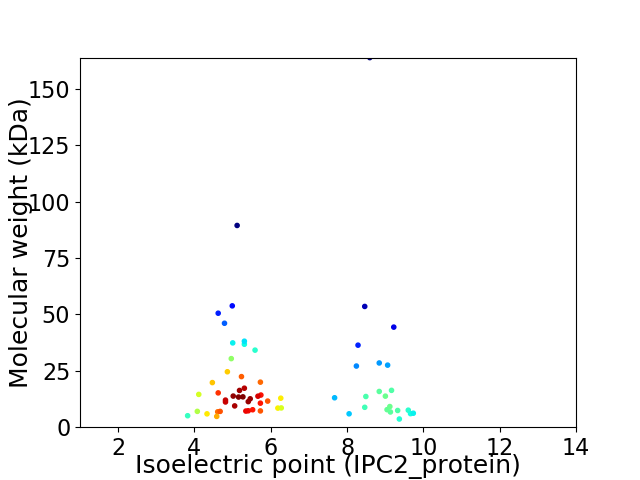
Virtual 2D-PAGE plot for 64 proteins (isoelectric point calculated using IPC2_protein)
Get csv file with sequences according to given criteria:
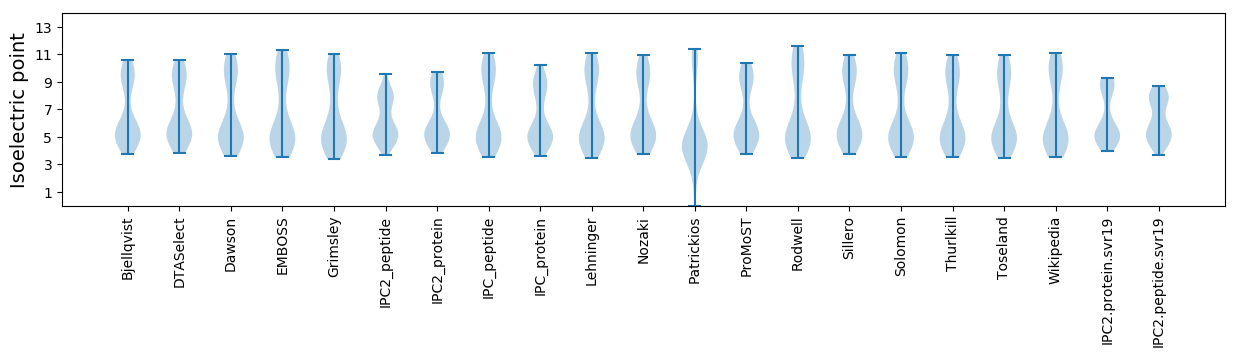
* You can choose from 21 different methods for calculating isoelectric point
Summary statistics related to proteome-wise predictions
Protein with the lowest isoelectric point:
>tr|D2IZS4|D2IZS4_9CAUD Uncharacterized protein gp32 OS=Enterococcus phage phiFL3A OX=673837 GN=gp32 PE=4 SV=1
MM1 pKa = 7.72GEE3 pKa = 3.9IAEE6 pKa = 4.25MMLEE10 pKa = 4.23GVLCASCGVFLDD22 pKa = 4.35VYY24 pKa = 10.63GNGYY28 pKa = 9.37PEE30 pKa = 4.12YY31 pKa = 10.98CEE33 pKa = 5.4DD34 pKa = 3.74CQEE37 pKa = 4.13QIIEE41 pKa = 4.03EE42 pKa = 4.18DD43 pKa = 3.31HH44 pKa = 6.38RR45 pKa = 5.97
MM1 pKa = 7.72GEE3 pKa = 3.9IAEE6 pKa = 4.25MMLEE10 pKa = 4.23GVLCASCGVFLDD22 pKa = 4.35VYY24 pKa = 10.63GNGYY28 pKa = 9.37PEE30 pKa = 4.12YY31 pKa = 10.98CEE33 pKa = 5.4DD34 pKa = 3.74CQEE37 pKa = 4.13QIIEE41 pKa = 4.03EE42 pKa = 4.18DD43 pKa = 3.31HH44 pKa = 6.38RR45 pKa = 5.97
Molecular weight: 5.09 kDa
Isoelectric point according different methods:
Protein with the highest isoelectric point:
>tr|D2IZT2|D2IZT2_9CAUD Terminase small subunit OS=Enterococcus phage phiFL3A OX=673837 GN=gp40 PE=4 SV=1
MM1 pKa = 8.19DD2 pKa = 4.69FLRR5 pKa = 11.84WIFVDD10 pKa = 3.79NDD12 pKa = 3.81GNFQWMSITALISAGGVWATFNRR35 pKa = 11.84SKK37 pKa = 10.58KK38 pKa = 9.01QYY40 pKa = 10.33RR41 pKa = 11.84LTFILKK47 pKa = 9.43QRR49 pKa = 11.84LKK51 pKa = 10.88SS52 pKa = 3.5
MM1 pKa = 8.19DD2 pKa = 4.69FLRR5 pKa = 11.84WIFVDD10 pKa = 3.79NDD12 pKa = 3.81GNFQWMSITALISAGGVWATFNRR35 pKa = 11.84SKK37 pKa = 10.58KK38 pKa = 9.01QYY40 pKa = 10.33RR41 pKa = 11.84LTFILKK47 pKa = 9.43QRR49 pKa = 11.84LKK51 pKa = 10.88SS52 pKa = 3.5
Molecular weight: 6.2 kDa
Isoelectric point according different methods:
Peptides (in silico digests for buttom-up proteomics)
Below you can find in silico digests of the whole proteome with Trypsin, Chymotrypsin, Trypsin+LysC, LysN, ArgC proteases suitable for different mass spec machines.| Try ESI |
 |
|---|
| ChTry ESI |
|
|---|
| ArgC ESI |
|
|---|
| LysN ESI |
|
|---|
| TryLysC ESI |
|
|---|
| Try MALDI |
|
|---|
| ChTry MALDI |
|
|---|
| ArgC MALDI |
|
|---|
| LysN MALDI |
|
|---|
| TryLysC MALDI |
|
|---|
| Try LTQ |
|
|---|
| ChTry LTQ |
|
|---|
| ArgC LTQ |
|
|---|
| LysN LTQ |
|
|---|
| TryLysC LTQ |
|
|---|
| Try MSlow |
|
|---|
| ChTry MSlow |
|
|---|
| ArgC MSlow |
|
|---|
| LysN MSlow |
|
|---|
| TryLysC MSlow |
|
|---|
| Try MShigh |
|
|---|
| ChTry MShigh |
|
|---|
| ArgC MShigh |
|
|---|
| LysN MShigh |
|
|---|
| TryLysC MShigh |
|
|---|
General Statistics
Number of major isoforms |
Number of additional isoforms |
Number of all proteins |
Number of amino acids |
Min. Seq. Length |
Max. Seq. Length |
Avg. Seq. Length |
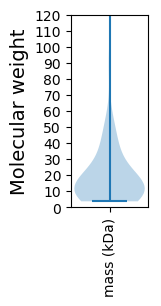
Avg. Mol. Weight |
|---|---|---|---|---|---|---|---|
0 |
11777 |
32 |
1511 |
184.0 |
20.83 |
Amino acid frequency
Ala |
Cys |
Asp |
Glu |
Phe |
Gly |
His |
Ile |
Lys |
Leu |
|---|---|---|---|---|---|---|---|---|---|
6.581 ± 0.404 | 0.594 ± 0.12 |
6.063 ± 0.297 | 8.05 ± 0.519 |
3.787 ± 0.166 | 6.326 ± 0.489 |
1.274 ± 0.136 | 6.997 ± 0.232 |
9.442 ± 0.357 | 8.695 ± 0.339 |
Met |
Asn |
Gln |
Pro |
Arg |
Ser |
Thr |
Val |
Trp |
Tyr |
|---|---|---|---|---|---|---|---|---|---|
2.361 ± 0.134 | 5.859 ± 0.247 |
3.006 ± 0.183 | 3.872 ± 0.249 |
3.965 ± 0.275 | 6.53 ± 0.382 |
5.231 ± 0.258 | 6.249 ± 0.203 |
1.265 ± 0.139 | 3.855 ± 0.322 |
Most of the basic statistics you can see at this page can be downloaded from this CSV file
See this proteome in:

Proteome-pI is available under Creative Commons Attribution-NoDerivs license, for more details see here
| Reference: Kozlowski LP. Proteome-pI 2.0: Proteome Isoelectric Point Database Update. Nucleic Acids Res. 2021, doi: 10.1093/nar/gkab944 | Contact: Lukasz P. Kozlowski |