Strawberry pallidosis-associated virus
Taxonomy: Viruses; Riboviria; Orthornavirae; Kitrinoviricota; Alsuviricetes; Martellivirales; Closteroviridae; Crinivirus
Average proteome isoelectric point is 6.63
Get precalculated fractions of proteins
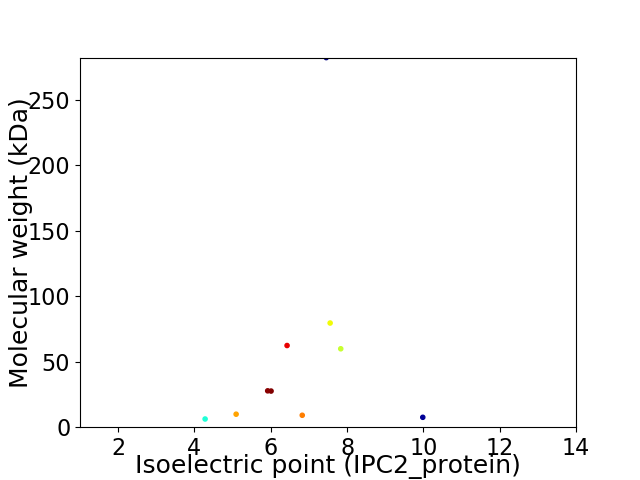
Virtual 2D-PAGE plot for 10 proteins (isoelectric point calculated using IPC2_protein)
Get csv file with sequences according to given criteria:
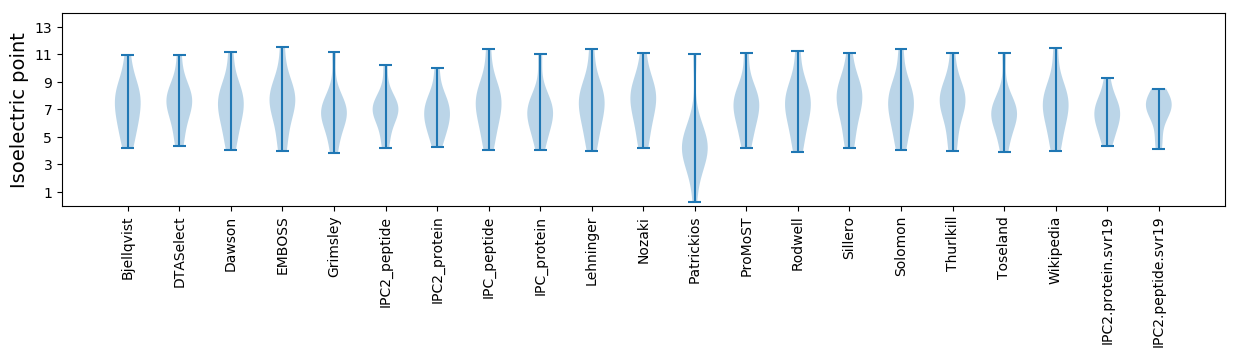
* You can choose from 21 different methods for calculating isoelectric point
Summary statistics related to proteome-wise predictions
Protein with the lowest isoelectric point:
>tr|Q6JGW2|Q6JGW2_9CLOS Movement protein OS=Strawberry pallidosis-associated virus OX=227507 PE=4 SV=1
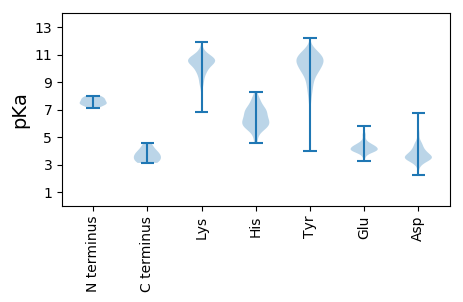
MM1 pKa = 7.59LFFVLIVSDD10 pKa = 3.4IGFNSYY16 pKa = 10.64YY17 pKa = 10.83LSDD20 pKa = 3.4NKK22 pKa = 10.44EE23 pKa = 4.12FEE25 pKa = 4.64GEE27 pKa = 4.34LIPIVTEE34 pKa = 3.87DD35 pKa = 3.42TTILIDD41 pKa = 3.99LLRR44 pKa = 11.84ICSFIKK50 pKa = 10.36EE51 pKa = 4.02RR52 pKa = 11.84WW53 pKa = 3.29
MM1 pKa = 7.59LFFVLIVSDD10 pKa = 3.4IGFNSYY16 pKa = 10.64YY17 pKa = 10.83LSDD20 pKa = 3.4NKK22 pKa = 10.44EE23 pKa = 4.12FEE25 pKa = 4.64GEE27 pKa = 4.34LIPIVTEE34 pKa = 3.87DD35 pKa = 3.42TTILIDD41 pKa = 3.99LLRR44 pKa = 11.84ICSFIKK50 pKa = 10.36EE51 pKa = 4.02RR52 pKa = 11.84WW53 pKa = 3.29
Molecular weight: 6.26 kDa
Isoelectric point according different methods:
Protein with the highest isoelectric point:
>tr|Q6JGW3|Q6JGW3_9CLOS ORF 2 OS=Strawberry pallidosis-associated virus OX=227507 PE=4 SV=1
MM1 pKa = 7.85DD2 pKa = 5.24KK3 pKa = 10.9EE4 pKa = 4.37SALHH8 pKa = 5.59VLLVLWHH15 pKa = 6.16IVWHH19 pKa = 5.7AMCYY23 pKa = 9.54IYY25 pKa = 10.88VVSFTARR32 pKa = 11.84DD33 pKa = 3.18HH34 pKa = 6.54RR35 pKa = 11.84RR36 pKa = 11.84FVRR39 pKa = 11.84PPHH42 pKa = 5.66TPQFKK47 pKa = 10.23RR48 pKa = 11.84KK49 pKa = 8.8RR50 pKa = 11.84KK51 pKa = 9.44LPRR54 pKa = 11.84ILLNVLAFF62 pKa = 4.2
MM1 pKa = 7.85DD2 pKa = 5.24KK3 pKa = 10.9EE4 pKa = 4.37SALHH8 pKa = 5.59VLLVLWHH15 pKa = 6.16IVWHH19 pKa = 5.7AMCYY23 pKa = 9.54IYY25 pKa = 10.88VVSFTARR32 pKa = 11.84DD33 pKa = 3.18HH34 pKa = 6.54RR35 pKa = 11.84RR36 pKa = 11.84FVRR39 pKa = 11.84PPHH42 pKa = 5.66TPQFKK47 pKa = 10.23RR48 pKa = 11.84KK49 pKa = 8.8RR50 pKa = 11.84KK51 pKa = 9.44LPRR54 pKa = 11.84ILLNVLAFF62 pKa = 4.2
Molecular weight: 7.55 kDa
Isoelectric point according different methods:
Peptides (in silico digests for buttom-up proteomics)
Below you can find in silico digests of the whole proteome with Trypsin, Chymotrypsin, Trypsin+LysC, LysN, ArgC proteases suitable for different mass spec machines.| Try ESI |
 |
|---|
| ChTry ESI |
|
|---|
| ArgC ESI |
|
|---|
| LysN ESI |
|
|---|
| TryLysC ESI |
|
|---|
| Try MALDI |
|
|---|
| ChTry MALDI |
|
|---|
| ArgC MALDI |
|
|---|
| LysN MALDI |
|
|---|
| TryLysC MALDI |
|
|---|
| Try LTQ |
|
|---|
| ChTry LTQ |
|
|---|
| ArgC LTQ |
|
|---|
| LysN LTQ |
|
|---|
| TryLysC LTQ |
|
|---|
| Try MSlow |
|
|---|
| ChTry MSlow |
|
|---|
| ArgC MSlow |
|
|---|
| LysN MSlow |
|
|---|
| TryLysC MSlow |
|
|---|
| Try MShigh |
|
|---|
| ChTry MShigh |
|
|---|
| ArgC MShigh |
|
|---|
| LysN MShigh |
|
|---|
| TryLysC MShigh |
|
|---|
General Statistics
Number of major isoforms |
Number of additional isoforms |
Number of all proteins |
Number of amino acids |
Min. Seq. Length |
Max. Seq. Length |
Avg. Seq. Length |
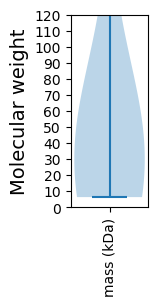
Avg. Mol. Weight |
|---|---|---|---|---|---|---|---|
0 |
4980 |
53 |
2451 |
498.0 |
57.2 |
Amino acid frequency
Ala |
Cys |
Asp |
Glu |
Phe |
Gly |
His |
Ile |
Lys |
Leu |
|---|---|---|---|---|---|---|---|---|---|
3.775 ± 0.453 | 1.968 ± 0.28 |
6.426 ± 0.332 | 5.823 ± 0.4 |
6.145 ± 0.484 | 4.639 ± 0.396 |
1.647 ± 0.28 | 7.309 ± 0.527 |
7.972 ± 0.304 | 9.598 ± 0.568 |
Met |
Asn |
Gln |
Pro |
Arg |
Ser |
Thr |
Val |
Trp |
Tyr |
|---|---|---|---|---|---|---|---|---|---|
2.47 ± 0.37 | 6.606 ± 0.469 |
3.092 ± 0.166 | 2.229 ± 0.177 |
4.819 ± 0.294 | 8.454 ± 0.27 |
5.201 ± 0.372 | 6.747 ± 0.348 |
0.582 ± 0.081 | 4.498 ± 0.363 |
Most of the basic statistics you can see at this page can be downloaded from this CSV file
See this proteome in:

Proteome-pI is available under Creative Commons Attribution-NoDerivs license, for more details see here
| Reference: Kozlowski LP. Proteome-pI 2.0: Proteome Isoelectric Point Database Update. Nucleic Acids Res. 2021, doi: 10.1093/nar/gkab944 | Contact: Lukasz P. Kozlowski |