Kutzneria buriramensis
Taxonomy: cellular organisms; Bacteria; Terrabacteria group; Actinobacteria; Actinomycetia; Pseudonocardiales; Pseudonocardiaceae; Kutzneria
Average proteome isoelectric point is 6.24
Get precalculated fractions of proteins
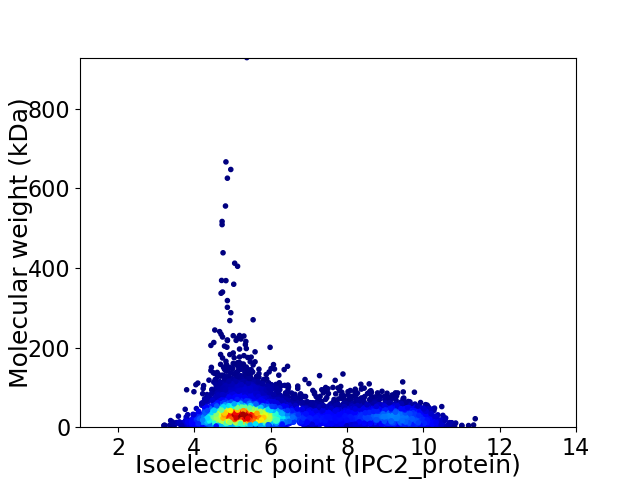
Virtual 2D-PAGE plot for 10965 proteins (isoelectric point calculated using IPC2_protein)
Get csv file with sequences according to given criteria:
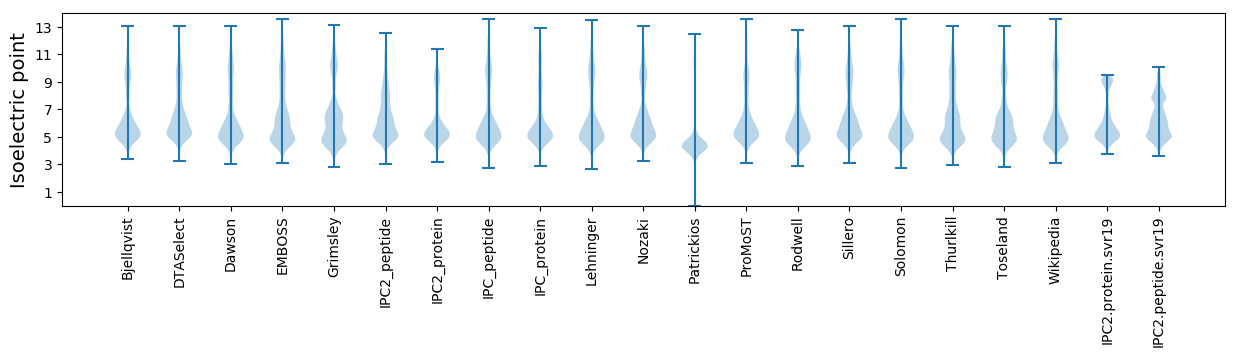
* You can choose from 21 different methods for calculating isoelectric point
Summary statistics related to proteome-wise predictions
Protein with the lowest isoelectric point:
>tr|A0A3E0G557|A0A3E0G557_9PSEU Uncharacterized protein OS=Kutzneria buriramensis OX=1045776 GN=BCF44_1412 PE=4 SV=1
MM1 pKa = 7.61AVQLDD6 pKa = 3.99PQLLEE11 pKa = 4.0ILRR14 pKa = 11.84CPSPDD19 pKa = 3.44HH20 pKa = 6.89APLRR24 pKa = 11.84PGTPDD29 pKa = 4.35DD30 pKa = 5.0ADD32 pKa = 5.07ADD34 pKa = 3.85MLTCTEE40 pKa = 4.47CGRR43 pKa = 11.84GYY45 pKa = 9.79PVQDD49 pKa = 4.97GIPVLLLDD57 pKa = 4.41EE58 pKa = 5.27AVPPPGGLAGG68 pKa = 3.78
MM1 pKa = 7.61AVQLDD6 pKa = 3.99PQLLEE11 pKa = 4.0ILRR14 pKa = 11.84CPSPDD19 pKa = 3.44HH20 pKa = 6.89APLRR24 pKa = 11.84PGTPDD29 pKa = 4.35DD30 pKa = 5.0ADD32 pKa = 5.07ADD34 pKa = 3.85MLTCTEE40 pKa = 4.47CGRR43 pKa = 11.84GYY45 pKa = 9.79PVQDD49 pKa = 4.97GIPVLLLDD57 pKa = 4.41EE58 pKa = 5.27AVPPPGGLAGG68 pKa = 3.78
Molecular weight: 7.09 kDa
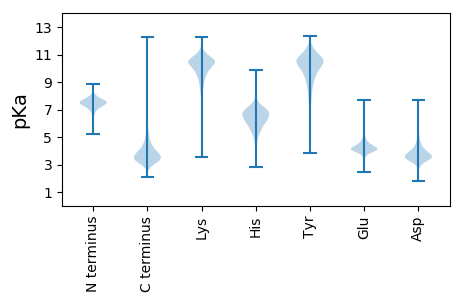
Isoelectric point according different methods:
Protein with the highest isoelectric point:
>tr|A0A3E0HU98|A0A3E0HU98_9PSEU Uncharacterized protein OS=Kutzneria buriramensis OX=1045776 GN=BCF44_104248 PE=4 SV=1
MM1 pKa = 7.53SKK3 pKa = 10.53GKK5 pKa = 8.66RR6 pKa = 11.84TFQPNNRR13 pKa = 11.84RR14 pKa = 11.84RR15 pKa = 11.84AKK17 pKa = 8.7THH19 pKa = 5.15GFRR22 pKa = 11.84LRR24 pKa = 11.84MRR26 pKa = 11.84TRR28 pKa = 11.84AGRR31 pKa = 11.84AILAARR37 pKa = 11.84RR38 pKa = 11.84GKK40 pKa = 10.37GRR42 pKa = 11.84ARR44 pKa = 11.84LSAA47 pKa = 3.91
MM1 pKa = 7.53SKK3 pKa = 10.53GKK5 pKa = 8.66RR6 pKa = 11.84TFQPNNRR13 pKa = 11.84RR14 pKa = 11.84RR15 pKa = 11.84AKK17 pKa = 8.7THH19 pKa = 5.15GFRR22 pKa = 11.84LRR24 pKa = 11.84MRR26 pKa = 11.84TRR28 pKa = 11.84AGRR31 pKa = 11.84AILAARR37 pKa = 11.84RR38 pKa = 11.84GKK40 pKa = 10.37GRR42 pKa = 11.84ARR44 pKa = 11.84LSAA47 pKa = 3.91
Molecular weight: 5.42 kDa
Isoelectric point according different methods:
Peptides (in silico digests for buttom-up proteomics)
Below you can find in silico digests of the whole proteome with Trypsin, Chymotrypsin, Trypsin+LysC, LysN, ArgC proteases suitable for different mass spec machines.| Try ESI |
 |
|---|
| ChTry ESI |
|
|---|
| ArgC ESI |
|
|---|
| LysN ESI |
|
|---|
| TryLysC ESI |
|
|---|
| Try MALDI |
|
|---|
| ChTry MALDI |
|
|---|
| ArgC MALDI |
|
|---|
| LysN MALDI |
|
|---|
| TryLysC MALDI |
|
|---|
| Try LTQ |
|
|---|
| ChTry LTQ |
|
|---|
| ArgC LTQ |
|
|---|
| LysN LTQ |
|
|---|
| TryLysC LTQ |
|
|---|
| Try MSlow |
|
|---|
| ChTry MSlow |
|
|---|
| ArgC MSlow |
|
|---|
| LysN MSlow |
|
|---|
| TryLysC MSlow |
|
|---|
| Try MShigh |
|
|---|
| ChTry MShigh |
|
|---|
| ArgC MShigh |
|
|---|
| LysN MShigh |
|
|---|
| TryLysC MShigh |
|
|---|
General Statistics
Number of major isoforms |
Number of additional isoforms |
Number of all proteins |
Number of amino acids |
Min. Seq. Length |
Max. Seq. Length |
Avg. Seq. Length |
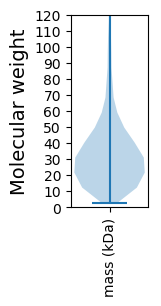
Avg. Mol. Weight |
|---|---|---|---|---|---|---|---|
0 |
3593623 |
25 |
8516 |
327.7 |
35.13 |
Amino acid frequency
Ala |
Cys |
Asp |
Glu |
Phe |
Gly |
His |
Ile |
Lys |
Leu |
|---|---|---|---|---|---|---|---|---|---|
13.216 ± 0.033 | 0.846 ± 0.008 |
6.232 ± 0.019 | 4.999 ± 0.026 |
2.841 ± 0.013 | 8.982 ± 0.022 |
2.296 ± 0.015 | 3.468 ± 0.013 |
1.94 ± 0.016 | 10.466 ± 0.033 |
Met |
Asn |
Gln |
Pro |
Arg |
Ser |
Thr |
Val |
Trp |
Tyr |
|---|---|---|---|---|---|---|---|---|---|
1.751 ± 0.008 | 2.162 ± 0.018 |
5.821 ± 0.022 | 3.12 ± 0.017 |
7.587 ± 0.029 | 5.276 ± 0.019 |
6.321 ± 0.026 | 9.004 ± 0.025 |
1.607 ± 0.01 | 2.066 ± 0.014 |
Most of the basic statistics you can see at this page can be downloaded from this CSV file
See this proteome in:

Proteome-pI is available under Creative Commons Attribution-NoDerivs license, for more details see here
| Reference: Kozlowski LP. Proteome-pI 2.0: Proteome Isoelectric Point Database Update. Nucleic Acids Res. 2021, doi: 10.1093/nar/gkab944 | Contact: Lukasz P. Kozlowski |