bacterium AMD01
Taxonomy: cellular organisms; Bacteria; unclassified Bacteria
Average proteome isoelectric point is 7.67
Get precalculated fractions of proteins
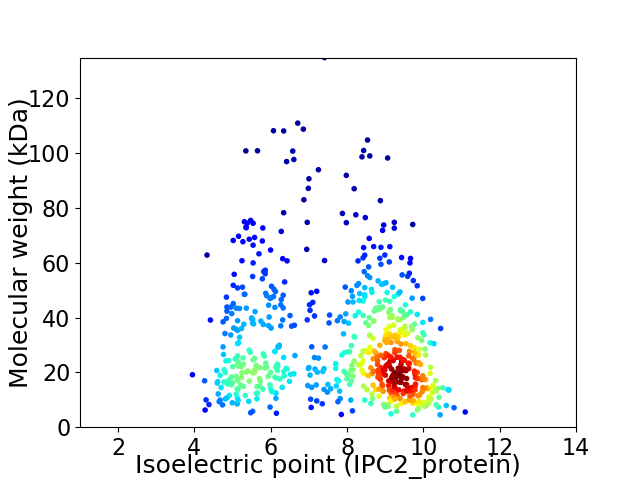
Virtual 2D-PAGE plot for 639 proteins (isoelectric point calculated using IPC2_protein)
Get csv file with sequences according to given criteria:
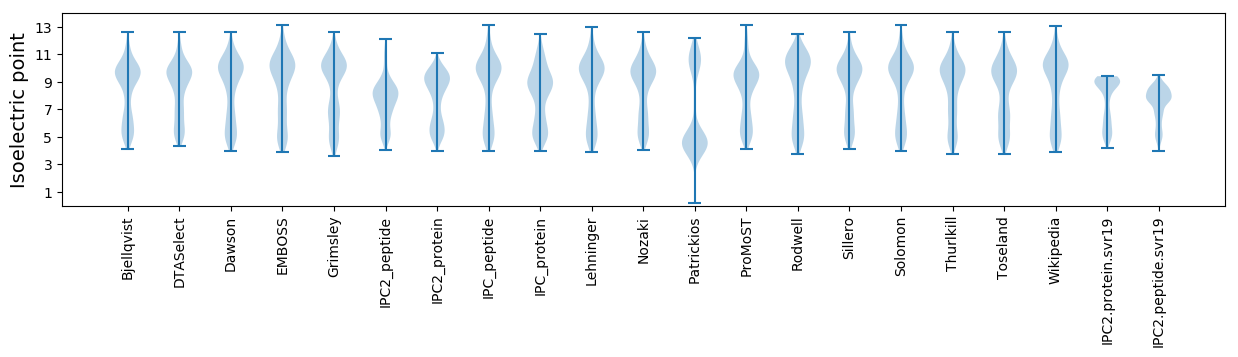
* You can choose from 21 different methods for calculating isoelectric point
Summary statistics related to proteome-wise predictions
Protein with the lowest isoelectric point:
>tr|A0A4Q0AKS7|A0A4Q0AKS7_9BACT Uncharacterized protein (Fragment) OS=bacterium AMD01 OX=2506947 GN=EOT04_00760 PE=4 SV=1
MM1 pKa = 7.21NQLLNDD7 pKa = 3.63NANADD12 pKa = 3.61KK13 pKa = 11.11VYY15 pKa = 10.59DD16 pKa = 3.95CVMVGAGPAALAAAVYY32 pKa = 7.45TARR35 pKa = 11.84EE36 pKa = 4.05NIEE39 pKa = 3.97TVLYY43 pKa = 9.47EE44 pKa = 3.86RR45 pKa = 11.84GVIGGLAAVTDD56 pKa = 4.16KK57 pKa = 11.36VDD59 pKa = 2.97NN60 pKa = 4.17
MM1 pKa = 7.21NQLLNDD7 pKa = 3.63NANADD12 pKa = 3.61KK13 pKa = 11.11VYY15 pKa = 10.59DD16 pKa = 3.95CVMVGAGPAALAAAVYY32 pKa = 7.45TARR35 pKa = 11.84EE36 pKa = 4.05NIEE39 pKa = 3.97TVLYY43 pKa = 9.47EE44 pKa = 3.86RR45 pKa = 11.84GVIGGLAAVTDD56 pKa = 4.16KK57 pKa = 11.36VDD59 pKa = 2.97NN60 pKa = 4.17
Molecular weight: 6.27 kDa
Isoelectric point according different methods:
Protein with the highest isoelectric point:
>tr|A0A4Q0AIZ8|A0A4Q0AIZ8_9BACT Hsp20/alpha crystallin family protein OS=bacterium AMD01 OX=2506947 GN=EOT04_02240 PE=3 SV=1
MM1 pKa = 8.03PKK3 pKa = 8.99RR4 pKa = 11.84TYY6 pKa = 9.7QPKK9 pKa = 9.45KK10 pKa = 7.36RR11 pKa = 11.84TRR13 pKa = 11.84AKK15 pKa = 9.29VHH17 pKa = 5.67GFRR20 pKa = 11.84ARR22 pKa = 11.84MASKK26 pKa = 9.21TGQRR30 pKa = 11.84VLKK33 pKa = 10.42SRR35 pKa = 11.84RR36 pKa = 11.84QKK38 pKa = 9.82GRR40 pKa = 11.84KK41 pKa = 8.36VLTVGRR47 pKa = 4.21
MM1 pKa = 8.03PKK3 pKa = 8.99RR4 pKa = 11.84TYY6 pKa = 9.7QPKK9 pKa = 9.45KK10 pKa = 7.36RR11 pKa = 11.84TRR13 pKa = 11.84AKK15 pKa = 9.29VHH17 pKa = 5.67GFRR20 pKa = 11.84ARR22 pKa = 11.84MASKK26 pKa = 9.21TGQRR30 pKa = 11.84VLKK33 pKa = 10.42SRR35 pKa = 11.84RR36 pKa = 11.84QKK38 pKa = 9.82GRR40 pKa = 11.84KK41 pKa = 8.36VLTVGRR47 pKa = 4.21
Molecular weight: 5.54 kDa
Isoelectric point according different methods:
Peptides (in silico digests for buttom-up proteomics)
Below you can find in silico digests of the whole proteome with Trypsin, Chymotrypsin, Trypsin+LysC, LysN, ArgC proteases suitable for different mass spec machines.| Try ESI |
 |
|---|
| ChTry ESI |
|
|---|
| ArgC ESI |
|
|---|
| LysN ESI |
|
|---|
| TryLysC ESI |
|
|---|
| Try MALDI |
|
|---|
| ChTry MALDI |
|
|---|
| ArgC MALDI |
|
|---|
| LysN MALDI |
|
|---|
| TryLysC MALDI |
|
|---|
| Try LTQ |
|
|---|
| ChTry LTQ |
|
|---|
| ArgC LTQ |
|
|---|
| LysN LTQ |
|
|---|
| TryLysC LTQ |
|
|---|
| Try MSlow |
|
|---|
| ChTry MSlow |
|
|---|
| ArgC MSlow |
|
|---|
| LysN MSlow |
|
|---|
| TryLysC MSlow |
|
|---|
| Try MShigh |
|
|---|
| ChTry MShigh |
|
|---|
| ArgC MShigh |
|
|---|
| LysN MShigh |
|
|---|
| TryLysC MShigh |
|
|---|
General Statistics
Number of major isoforms |
Number of additional isoforms |
Number of all proteins |
Number of amino acids |
Min. Seq. Length |
Max. Seq. Length |
Avg. Seq. Length |
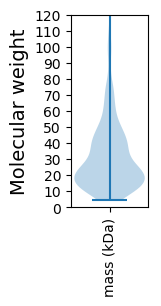
Avg. Mol. Weight |
|---|---|---|---|---|---|---|---|
0 |
184683 |
38 |
1213 |
289.0 |
31.79 |
Amino acid frequency
Ala |
Cys |
Asp |
Glu |
Phe |
Gly |
His |
Ile |
Lys |
Leu |
|---|---|---|---|---|---|---|---|---|---|
10.602 ± 0.12 | 0.593 ± 0.03 |
5.142 ± 0.07 | 5.261 ± 0.105 |
3.495 ± 0.078 | 7.643 ± 0.094 |
1.782 ± 0.045 | 5.481 ± 0.071 |
5.35 ± 0.085 | 10.829 ± 0.141 |
Met |
Asn |
Gln |
Pro |
Arg |
Ser |
Thr |
Val |
Trp |
Tyr |
|---|---|---|---|---|---|---|---|---|---|
2.019 ± 0.042 | 3.611 ± 0.07 |
4.838 ± 0.076 | 4.259 ± 0.067 |
6.61 ± 0.091 | 6.243 ± 0.076 |
4.862 ± 0.072 | 7.22 ± 0.09 |
1.165 ± 0.046 | 2.994 ± 0.056 |
Most of the basic statistics you can see at this page can be downloaded from this CSV file
See this proteome in:

Proteome-pI is available under Creative Commons Attribution-NoDerivs license, for more details see here
| Reference: Kozlowski LP. Proteome-pI 2.0: Proteome Isoelectric Point Database Update. Nucleic Acids Res. 2021, doi: 10.1093/nar/gkab944 | Contact: Lukasz P. Kozlowski |